Forex Signals Brief August 21: FOMC Minutes Unlikely to Spark Action
Today the FOMC meeting minutes will the the only calendar release, but they're unlikely to offer much volatility ahead of the Jackson Hole.

The markets experienced significant movement today, despite a lack of major news. The euro climbed to its highest levels of the year as the dollar continued its steady decline. Treasury yields also fell, accompanied by consistent dollar selling across the board. The market is factoring in a potential drop in Fed funds and inflation, fueled by strong global growth and a robust US economy.

These factors have contributed to the dollar’s weakness and a selloff of long positions. USD/JPY continued declines, while US stock indices ended the winning streak as they closed the day slightly lower. Oil prices, which have dropped for the fifth time in six days, are reinforcing the disinflation narrative. Meanwhile, GOLD surged to a new record high of $2,531 before retreating by more than $30.
The key economic event yesterday was the release of Canada’s CPI inflation data. Canada’s CPI fell to +2.5% year-over-year in July, as expected, down from +2.7% the previous year. However, the Bank of Canada’s core CPI dropped to +1.7%, down from +1.9% previously, making the Canadian dollar the second weakest currency of the day after the USD.
Today’s Market Expectations
Today the FOMC meeting minutes are the most important and only release of the day. During the July meeting, the FOMC kept interest rates steady at 5.50% but adjusted its statement to suggest that a rate cut in September remains a possibility. Unlike the June statement, which emphasized sensitivity to inflation risks, the July statement highlighted that the Committee is now considering risks on both sides of its mandate. The statement acknowledged “further progress” toward the Fed’s inflation target and noted that the risks to achieving its employment and inflation goals are becoming more balanced.
However, the Fed also made it clear that it does not plan to reduce rates until there is stronger confidence that inflation is on a sustainable path toward the target. This implies that the Committee is waiting for more favorable economic data before committing to rate cuts. At his post-meeting press conference, Chair Powell disclosed that while there was a genuine discussion about the case for lowering rates, the majority opposed any immediate action. Powell emphasized that the current policy rate is restrictive and suggested that the time is approaching when it will be appropriate to begin reducing rates and easing restrictions to support the economy’s ongoing growth.
Yesterday there was enough price action in the markets despite the economic calendar being light, apart from the Canadian CPI inflation report. We opened seven trading signals, however, only four of them closed at the end of the day, three of which bit the take profit target, while one close in loss.
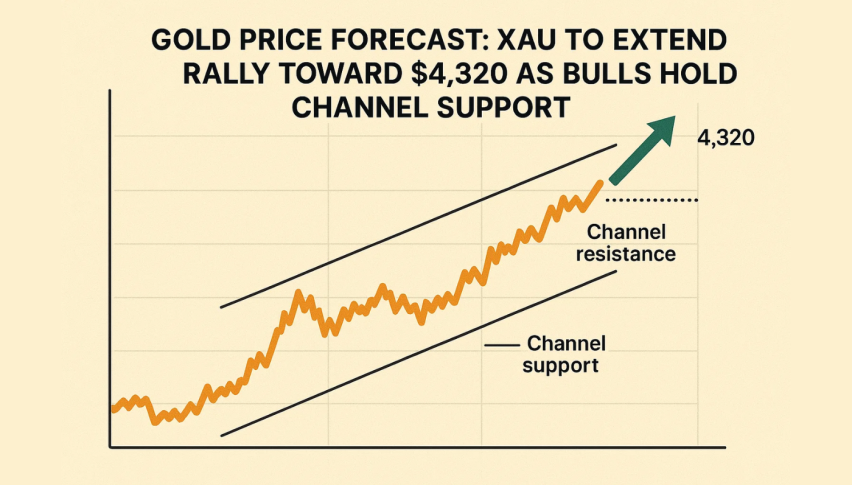
Gold Holds Above $2,500
Gold prices have consistently attracted buyers on every dip, indicating a strong upward trend that could see the recent breakout extend further. Global demand continues to be a key factor in gold’s rise. In India, physical gold purchases have seen a slight uptick due to price adjustments, while in China, rising premiums point to increasing demand for gold as a safe-haven asset. Gold (XAU/USD) reached a new all-time high on Friday and has continued to climb, hitting $2,531 yesterday, largely driven by the weakening US dollar.
XAU/USD – Daily chart
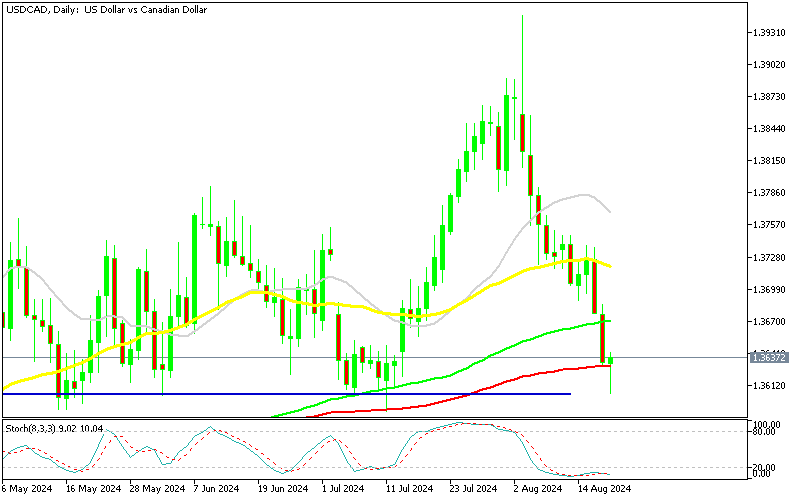
USD/CAD Tests the 100 Daily SMA
USDCAD saw a sharp reversal in early August after a strong rise in July, dropping over 3.5 cents. However, the decline may have found a bottom today. After surging in July, the pair began to retreat as risk sentiment improved, erasing previous gains. Support has emerged at the 100-day SMA, suggesting that the downtrend might be nearing its end, especially given the mixed underlying fundamentals.
USD/CAD – Daily Chart
Cryptocurrency Update
Bitcoin Consolidating Close to $60k
Bitcoin experienced a sharp decline midweek, falling around 3% to the $57,700 level, leading to significant losses across the broader cryptocurrency market. Earlier this week, Bitcoin briefly spiked to $61,830, driven by interest in Bitcoin ETFs and large investments from major financial firms like MicroStrategy. Despite these gains, Bitcoin’s price remains volatile, hovering around $60,000.
BTC/USD – Daily chart
Ethereum Holds Below the 20 Daily SMA
Ethereum has also been in a downward trend since March, with lower highs suggesting more potential declines in August. In June, Ethereum’s price dropped from $3,830 to below $3,000. Although buying pressure temporarily lifted the price above the 50-day SMA, renewed selling led to another bearish reversal. The price dipped below the 200-day SMA before recovering from a low of $2,000 to around $2,600, breaking through the 20-day SMA in the process.
ETH/USD – Daily chart
- Check out our free forex signals
- Follow the top economic events on FX Leaders economic calendar
- Trade better, discover more Forex Trading Strategies
- Open a FREE Trading Account


