
SHOP

 <% (signals.list.current.rate).substr(0,7) %>
 <% signal.analyst %>

Last Updated: Jun 24, 2026 03:24:57 PM (GMT)
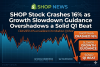
SHOP: The current market price is 111.97, reflecting a percentage change of +4.22% from the previous price.
Support and Resistance Levels The three support levels are 106.45333, 106.18667, and 105.65333, while the three resistance levels are 107.25333, 107.78667, and 108.05333. The pivot point is 106.98667.
Indicators Current RSI is 38.02, indicating a declining trend. The ATR stands at 0.67569, suggesting typical volatility. The MACD shows a current value of -0.20493, with a bear trend observed. The current Parabolic SAR is at 109.51986, indicating a potential rising trend.
Market Sentiment The market price is above the pivot point of 106.98667, indicating a bullish outlook supported by indicating trends.
SHOP Signals & Technical Analysis
Market Sentiment
Trend Indicators
Oscillators
Moving Averages
Pivot
About (SHOP) Shopify Inc.
Company Background
Shopify Inc. (Symbol: SHOP), headquartered in Ottawa, Canada, is a leading e-commerce platform that empowers businesses of all sizes to create, manage, and grow their online stores. Founded in 2006 by Tobias Lütke, Daniel Weinand, and Scott Lake, Shopify began as a simple online store for snowboarding equipment and has since transformed into one of the most comprehensive e-commerce solutions available. The platform offers a wide range of tools and services, enabling entrepreneurs to build their brands, manage inventory, process payments, and analyze sales in real time, all in one place.
Market Position
As a pioneer in the e-commerce industry, Shopify has established a strong market position, serving over 1.7 million businesses across more than 175 countries. The platform caters to various sectors, including retail, subscription services, and digital goods, making it a versatile choice for entrepreneurs. Shopify's user-friendly interface, extensive app ecosystem, and customizable templates have made it a preferred choice for many small to medium-sized enterprises (SMEs) as well as larger corporations. With innovative features such as Shopify Plus for enterprise-level clients and Shopify Payments for streamlined transactions, the company continues to strengthen its foothold in the competitive e-commerce landscape.
Key Financial and Industry Highlights
Shopify has consistently reported robust revenue growth, with its annual revenue surpassing CAD $4 billion in recent fiscal years, highlighting the increasing demand for e-commerce solutions. The company's strategic investments in technology, including artificial intelligence and machine learning, further enhance its platform capabilities and customer experience. In recent quarters, Shopify's stock performance on the NEO Exchange reflects positive investor sentiment, driven by strong user adoption rates and expanding market share. Additionally, the company's focus on sustainability and support for small businesses aligns with evolving consumer preferences, positioning Shopify for future growth in the dynamic e-commerce sector.
How to Buy or Trade Shopify Inc. Stock (SHOP) with AvaTrade
Trading or investing in Shopify Inc. stock through AvaTrade starts with opening a verified trading account. After registration, complete the KYC verification process by submitting your ID and proof of address, then fund your account using a supported payment method such as bank transfer, debit card, or e-wallet. Once your funds reflect, log into the AvaTrade platform or mobile app and search for the ticker symbol SHOP, which represents Shopify Inc.. Before placing a trade, review the live Shopify Inc. share price, market trend, spread, leverage options, and recent market news that could impact the stock price.
The next step is deciding whether you want to buy or sell Shopify Inc. stock. Traders expecting the price to rise typically open a Buy position, while traders expecting weakness in the sector may open a Sell position using CFDs. Enter your preferred trade size, then apply risk management tools such as a stop-loss to limit downside exposure and a take-profit order to secure profits automatically. After confirming the trade, monitor key drivers including Shopify Inc. earnings reports, product or service announcements, business segment performance, revenue growth, and overall stock market sentiment. Many traders also use technical indicators such as moving averages, RSI, and support/resistance levels available on the AvaTrade platform to improve timing and trading decisions.
Related Stocks


Sidebar rates
- <% signal.pair %>
 <% signals.active.Current.rate.substr(0,7) %>
