Crypto Strategy: Bollinger Bands (BBs)

Bollinger Bands are a volatility indicator used in crypto trading to show when price is high, low, or compressed relative to its recent average. Traders use the upper band, lower band, and middle SMA to identify breakouts, mean reversion, trend strength, and potential overbought or oversold conditions.
What are Bollinger Bands?
Bollinger Bands are a technical analysis tool developed by John Bollinger in the 1980s, designed to measure market volatility and identify potential trading opportunities.
The indicator consists of three lines: a middle line, which is a simple moving average (SMA), and two standard deviation lines known as the upper and lower bands.
These bands create an envelope around the price chart, providing a visual representation of market volatility. Widely used in financial markets, Bollinger Bands help traders analyze price movements and make informed trading decisions by highlighting periods of high and low volatility.
Can beginners use Bollinger Bands?
Absolutely. Bollinger Bands are relatively easy to understand and are available on most trading platforms. Beginners should focus on learning how to combine them with trend analysis, confirmation indicators, and disciplined risk management rather than treating every band touch as a trading signal.
Key Takeaways
If you’re new to Bollinger Bands, these are the most important points to remember before placing a trade:
- Bollinger Bands measure market volatility, not whether an asset is bullish or bearish.
- A Bollinger Band Squeeze often signals that a significant price move could be approaching, although it doesn’t indicate the direction.
- Prices can ride the upper or lower band during strong trends, so touching a band alone isn’t a reliable buy or sell signal.
- Combining Bollinger Bands with indicators like RSI, MACD, or trading volume can help reduce false signals.
- Risk management is essential. Always define your stop-loss and take-profit levels before entering a trade.
- Bollinger Bands work best when combined with price action, support and resistance, and trend analysis rather than being used as a standalone indicator.
- No trading strategy guarantees profits, but Bollinger Bands can help traders make more informed decisions when used correctly.
Bollinger Bands Strategy for Crypto Trading overview
- Understanding Bollinger Bands Indicator
- How Does The Bollinger Band Strategy Work?
- How Is The Bollinger Band Strategy Used In Crypto?
- Advanced Bollinger Bands Strategies
- Bollinger Bands in Different Trading Styles
- Things To Watch For When Trading Crypto With Bollinger Bands
- Predicting Crypto Prices With Bollinger Bands Amid Market Volatility
- Pros And Cons
- Conclusion
Understanding Bollinger Bands Indicator
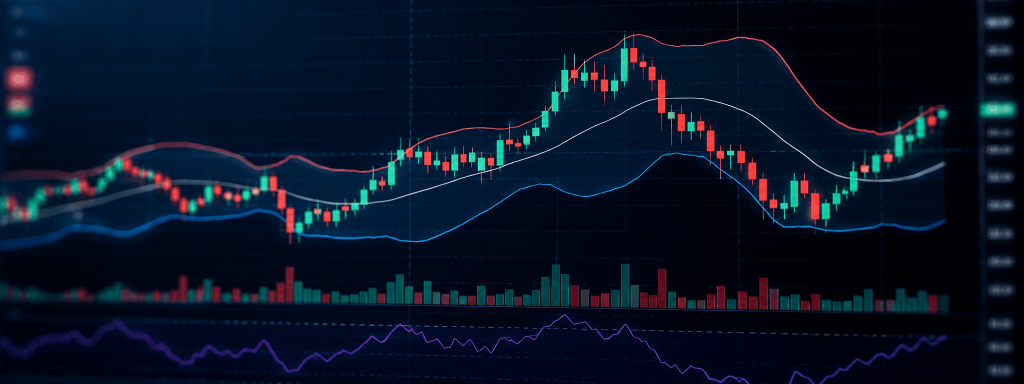
The Bollinger Bands indicator is a powerful tool for traders to gauge market volatility and identify potential trading opportunities. This indicator consists of three lines: a simple moving average (SMA) in the center, flanked by two standard deviation lines above and below it.
The upper and lower bands are typically set at two standard deviations away from the moving average.
The primary purpose of Bollinger Bands is to offer a visual representation of the volatility of a financial instrument over time, helping traders to understand the market’s behavior and make strategic decisions based on price movements.
Bollinger Bands Components
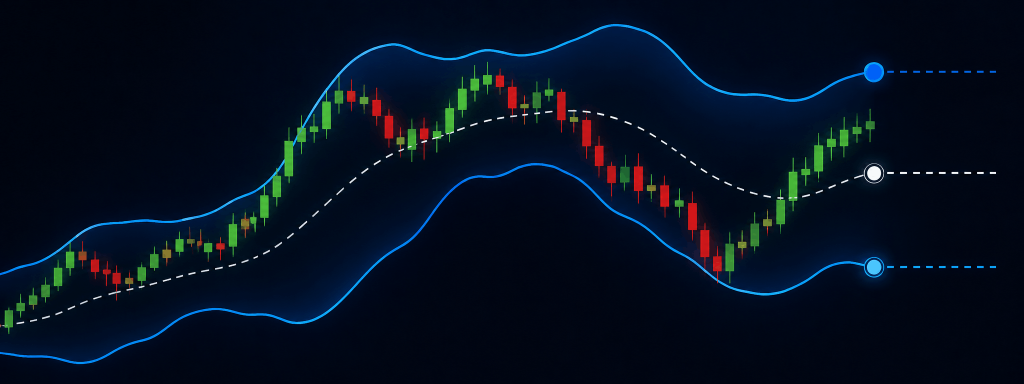
The Bollinger Bands indicator consists of three main components:
- Middle Line (Simple Moving Average): The middle line is a simple moving average (SMA) of the price chart, usually set to 20 periods. This line serves as the baseline around which the upper and lower bands are plotted.
- Upper Band: The upper band is calculated by adding a set number of standard deviations (usually 2) to the middle line. This band represents the upper boundary of price movements and can indicate overbought conditions.
- Lower Band: The lower band is calculated by subtracting the same set number of standard deviations (usually 2) from the middle line. This band represents the lower boundary of price movements and can indicate oversold conditions.
How Does The Bollinger Band Strategy Work?
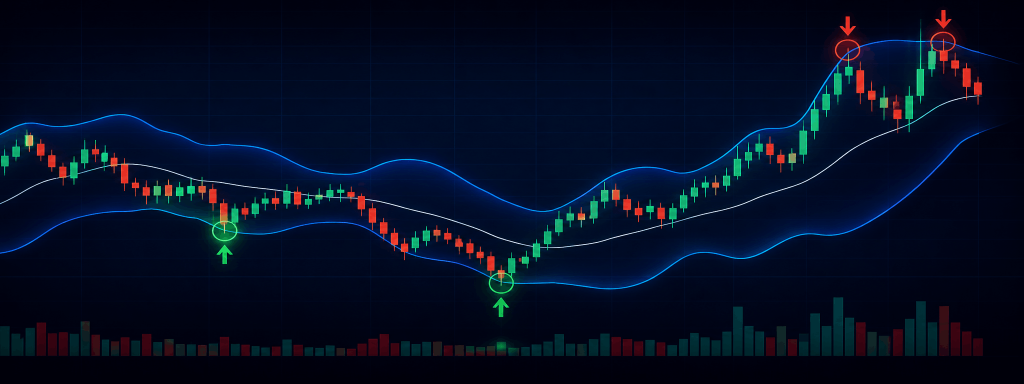
Bollinger Bands are practical tools for market entry, trade management, and strategic development. One of the great things about the indicator is that combining Bollinger Bands with other strategies is readily accomplished. Separate indicators such as Exponential Moving Averages (EMA), Stochastics or the Relative Strength Index (RSI) may be routinely applied.
Moving Average Convergence Divergence (MACD) is also a valuable complementary technical analysis tool to confirm signals provided by Bollinger Bands.
For active traders, BBs are simple to use. All calculations are performed automatically by the software trading suite and plotted graphically as a chart overlay. Below are the key steps in applying the Bollinger Band strategy for cryptos:
- Configure: Before using, the BBs must be configured by the trader. This means that ideal standard deviations and SMA settings need to be chosen. Typically, a standard deviation of 2.0 and SMA period of 20 is used. However, these values are fully customizable.
- Trend: For trend trading, the upper and lower BBs are exceedingly important. In a trending market, the distance between the BBs is wide. If a price bar closes outside of an upper or lower band, the periodic trend is expected to continue. If a price bar closes inside of the BBs, price is expected to move sideways or reverse course.
- Rotational Markets: In the event that the upper and lower BBs are close together, a rotational or reversion-to-the-mean strategy is advised.
How Is The Bollinger Band Strategy Used In Crypto?
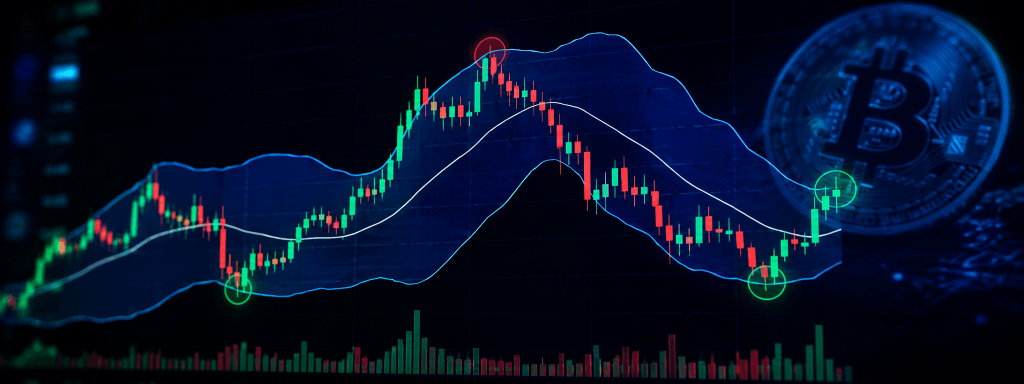
In the trade of cryptocurrencies, Bollinger Bands are used primarily to identify market state. The beauty of BBs is that they furnish the user with a straightforward representation of price action. Accordingly, there are two elements of this strategy to be aware of in regards to market state:
- Consolidation: In the event that the upper and lower BBs are close together or “tight,” a market is in consolidation. This means that periodic trading ranges are small, price action is choppy, and participation is balanced. Under this scenario, the BBs are viewed as viable support and resistance levels.
- Trending: When the upper and lower BBs are far apart, a market is exhibiting heightened volatility and likely trending. Prices are moving directionally, extending the periodic trading range. In trending crypto markets, BBs act as directional indicators, not necessarily support or resistance levels.
The weekly chart for
below gives us a good look at how BBs function in real time. Under this scenario, the ETH/USD is in the midst of an extended bullish trend.
As you can see, the upper and lower BBs are extremely wide and near parallel. If the current weekly bar closes above the upper BB, a long trade is advised.
Advanced Bollinger Bands Strategies
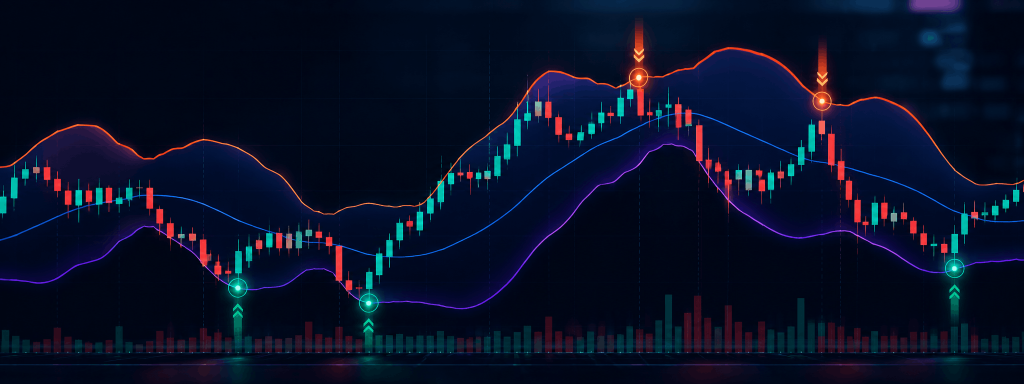
Bollinger Bands can be used in various trading strategies, including:
- Momentum Strategy: This strategy involves buying when the price touches or breaks above the upper band and selling when the price touches or breaks below the lower band. It capitalizes on strong price movements and trends.
- Mean Reversion Strategy: In this approach, traders buy when the price moves outside the upper or lower band and sell when the price returns to the middle line. This strategy assumes that prices will revert to their mean over time.
- Squeeze Strategy: This strategy identifies a contraction in the Bollinger Bands, known as a “squeeze,” which often precedes a breakout. Traders wait for the bands to tighten and then trade the breakout direction.
- Double Bollinger Band Strategy: This advanced strategy uses two sets of Bollinger Bands with different standard deviations to filter out false signals and confirm trend changes. It provides a more nuanced view of market conditions and helps in making more accurate trading decisions.
Bollinger Bands in Different Trading Styles
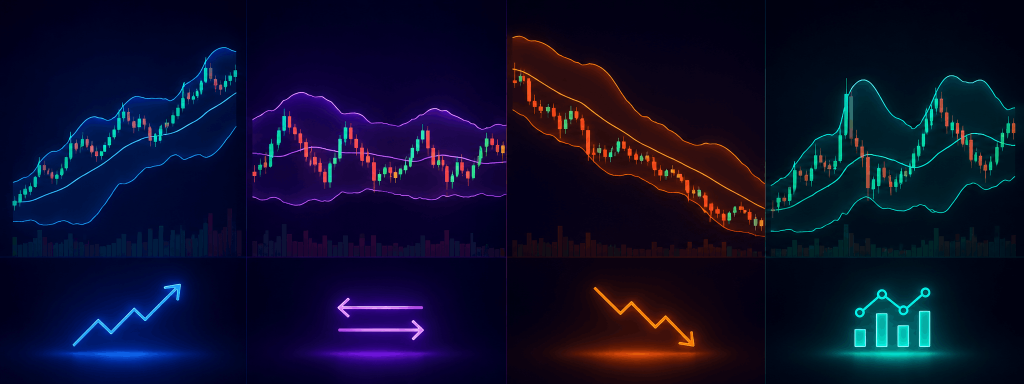
Bollinger Bands can be adapted to various trading styles, making them a versatile tool for traders:
- Scalping: Scalpers use Bollinger Bands to identify small price movements and profit from them. The bands help in pinpointing entry and exit points for quick trades.
- Day Trading: Day traders rely on Bollinger Bands to identify potential trading opportunities within a single trading day. The bands provide insights into intraday price movements and volatility.
- Swing Trading: Swing traders use Bollinger Bands to identify potential trading opportunities and hold positions for several days or weeks. The bands help in capturing larger price movements and trends.
- Position Trading: Position traders use Bollinger Bands to identify long-term trading opportunities and hold positions for extended periods. The bands assist in understanding the broader market trends and making informed decisions.
By incorporating Bollinger Bands into these different trading styles, traders can enhance their ability to analyze price movements and make strategic decisions based on market volatility.
Things To Watch For When Trading Crypto With Bollinger Bands

Like all indicators, there are certain things to be aware of when trading cryptos with BBs. Here’s a quick look at three key elements:
1. Market State with Bollinger Bands (BBs)
Bollinger Bands (BBs) provide valuable insights into the current market state by adapting to price volatility. Here’s how traders interpret BBs in trending markets:
Market Trend Indicator:
- In a trending market, BBs indicate direction rather than acting as firm support or resistance levels.
- For instance, when both the upper and lower BBs slope downward and widen, it indicates a strong downtrend, signaling increased volatility and bearish momentum.
Downtrend Example:
- If the distance between the bands is wide and the slope is steepening, the cryptocurrency is likely in a heavy downward trend.
- The lower BB here shouldn’t be viewed as a support level but as an indicator of strong bearish sentiment.
Trade Entry Signal:
- In this scenario, traders would look for the price to close above the lower BB as an early sign of trend exhaustion before considering a long (buy) trade.
- Many traders place buy orders when the price briefly touches or breaks below the lower band, anticipating a potential reversal or pullback.
By treating the lower BB as a signal of market strength and not a support level, traders can better interpret the intensity of the current trend and plan trades accordingly.
2. Periodicity in Bollinger Bands (BBs)
The periodicity, or timeframe, of a chart is essential when using Bollinger Bands (BBs), as it should align with your trading strategy. Here’s how periodicity impacts BBs in different trading approaches:
Understanding Periodicity:
- Periodicity refers to the time duration of each price bar on your chart (e.g., 1 minute, 1 hour, 1 day).
- Choosing the right periodicity ensures that your Bollinger Bands reflect price action relevant to your strategy.
Short-Term Trading:
- For strategies like scalping (making quick trades to capture small price moves), short timeframes such as 1- or 5-minute charts are often ideal.
- Using short periodicity allows you to assess market state in real time, making rapid, responsive trading decisions.
Longer-Term Strategies:
- For day trading or swing trading (holding trades for hours or days), longer periodicities like 15-minute, 1-hour, or daily charts are more appropriate.
- These longer timeframes capture broader market trends and help avoid the noise that’s often present in shorter intervals.
Always match your Bollinger Bands’ periodicity with your specific trading strategy to ensure you’re interpreting market data in a meaningful and actionable way.
3. Trend vs. Rotational Trading with Bollinger Bands (BBs)
Bollinger Bands (BBs) are versatile indicators that can be applied effectively in both trending and rotational (sideways) markets. Here’s how BBs help traders adapt their strategies for different market conditions:
Dual Use in Crypto Markets:
- BBs provide reliable signals in both trending (directional) and rotational (sideways) markets, common scenarios in cryptocurrency trading.
- The indicator’s flexibility allows traders to adjust risk-to-reward ratios to maximize potential profits in each type of market.
Trending Market Strategy:
- For trend trades, a 1:3 risk-to-reward ratio is often recommended. This setup lets traders capitalize on larger directional price moves.
- In a strong uptrend, for example, traders may set their profit target three times the distance of their initial stop-loss, allowing for higher returns on successful trades.
Rotational Market Strategy:
- In a rotational market (where prices fluctuate within a range), a more conservative 1:1 or 1:2 risk-to-reward ratio is advisable since the potential gains are usually smaller.
- When trading in consolidation, traders often place orders at the upper or lower Bollinger Bands, aiming for a profit target around the midpoint (SMA).
Example Trade Setup:
- In a rotational market, traders may place short orders when the price touches the upper BB and set their profit target near the middle band, or SMA.
- This approach ensures profits are aligned with the more limited price range typical of rotational markets.
By adjusting risk-to-reward ratios according to market type, traders can effectively use BBs to manage their trades and maintain consistent profitability in both trending and rotational crypto markets.
Bollinger Bands vs RSI vs MACD
| Feature | Bollinger Bands | RSI | MACD |
| Primary Purpose | Measure volatility | Measure momentum | Identify trend direction |
| Best For | Breakouts and volatility expansion | Overbought and oversold conditions | Trend confirmation |
| Generates Buy/Sell Signals | Sometimes | Yes | Yes |
| Works Well During Trends | Yes | Moderate | Excellent |
| Works Well in Ranging Markets | Good | Excellent | Moderate |
| Best Used With | RSI, MACD, Volume | Bollinger Bands | Bollinger Bands |
| Beginner Friendly | Yes | Yes | Moderate |
Common False Bollinger Band Signals
Although Bollinger Bands are widely used, they can produce misleading signals, particularly during volatile cryptocurrency markets.
Understanding these situations can help traders avoid unnecessary losses.
1. Buying Simply Because Price Touches the Lower Band
One of the biggest misconceptions is believing every touch of the lower band signals a buying opportunity.
In strong downtrends, price can continue falling while repeatedly touching or moving outside the lower band.
Better approach: Wait for bullish confirmation, such as a reversal candlestick, RSI divergence, or increased buying volume.
2. Selling Because Price Hits the Upper Band
During strong bull markets, Bitcoin and other cryptocurrencies can remain near the upper Bollinger Band for extended periods.
Selling too early often means missing much larger gains.
Instead, look for:
- Bearish divergence
- Falling momentum
- Resistance
- Declining volume
3. Trading Every Bollinger Band Squeeze
Not every squeeze leads to a major breakout.
Some breakouts fail quickly and reverse back into the trading range.
Improve accuracy by confirming:
- Volume expansion
- Break of market structure
- Trend direction
- Higher timeframe confirmation
4. Ignoring Market Context
Bollinger Bands should never replace overall market analysis.
Before entering a trade, consider:
- Major support and resistance levels
- Economic news
- Bitcoin dominance
- Overall market sentiment
These factors often have a greater impact on price than technical indicators alone.
5. Using Bollinger Bands Alone
No technical indicator is accurate 100% of the time.
The most consistent traders combine Bollinger Bands with:
- RSI
- MACD
- Moving averages
- Volume analysis
- Candlestick patterns
- Risk management rules
This layered approach helps filter out lower-quality trading opportunities.
Predicting Crypto Prices With Bollinger Bands Amid Market Volatility

Crypto price prediction is a difficult business and far from a true science. Bollinger Bands consist of three lines on a price chart: a central moving average and the upper and lower bands that represent standard deviations from this average. Nonetheless, BBs are useful in projecting where a market is heading and how it may get there.
One way to forecast future crypto price levels using Bollinger Bands is to observe volatility. If the bands are wide open and have formidable slopes, it’s probable that the prevailing trend will continue.
If the bands tighten and flatten out, price is likely to stay near current levels for some time. Although these guidelines do not define precise price points, they may be used to identify periodic ranges for any crypto being traded.
Common Mistakes To Avoid When Using Bollinger Bands
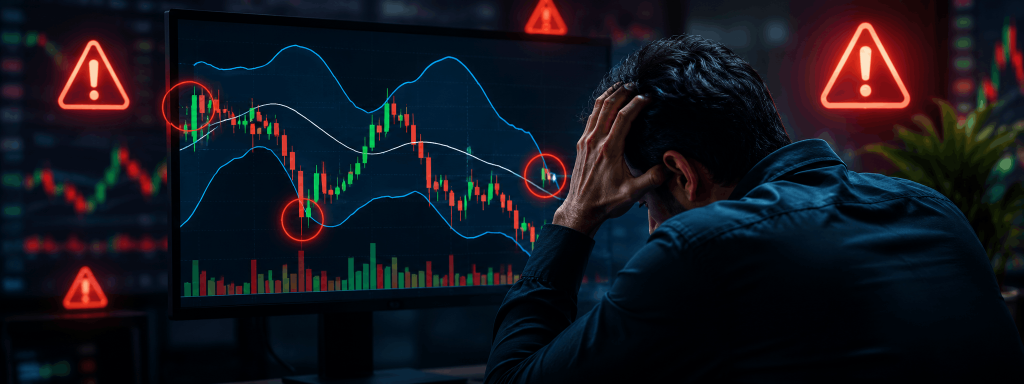
Unfortunately, BBs aren’t the holy grail to becoming a profitable crypto trader. Here are three mistakes commonly made by practitioners of the strategy:
- Lack A Plan: Without solid guidelines for risk and money management, BB traders often sustain big losses. It’s important to implement BBs as part of a comprehensive trading plan, not on a standalone basis.
- Use Too Much Leverage: Bollinger Bands aren’t infallible! Many traders apply too much leverage on a single or series of trades. This can lead to huge losses and rapidly blowing out the trading account.
- Ignore Periodicity: It’s imperative that the duration of the price chart reflects the strategy. If not, the Bollinger Bands’ representation of market state is largely useless. Compare apples to apples, not apples to oranges!
Pros And Cons
| ✓ Pros | ✕ Cons |
| Provides clear entry and exit points by helping traders identify potential buy and sell opportunities based on price action and technical indicators. | Can generate conflicting signals, especially when multiple indicators point in different directions, leading to analysis paralysis. |
| Identifies market trends and reversals, making it easier to spot bullish and bearish momentum before major price moves. | May become less reliable during major news events, when sudden volatility overrides historical price patterns. |
| Works well alongside fundamental and volume analysis, giving traders a more comprehensive view of the cryptocurrency market. | Can overwhelm beginners due to the large number of indicators, chart patterns, and analytical tools available. |
Conclusion
Bollinger Bands are a great way to begin integrating technical analysis into your trading plan. BBs are user-friendly and can provide valuable insight into a cryptocurrency’s behavior. If you’re ready to realize the potential of Bollinger Bands in crypto trading, add BBs to your price charts and get started.
You might also like:
What is a Decentralized Application
Parabolic SAR Trading Strategy
Frequently Asked Questions
Are Bollinger Bands a reliable indicator for crypto trading?
Bollinger Bands can be a valuable tool for crypto traders because they measure market volatility and highlight periods of potential opportunity. However, they shouldn’t be used in isolation. The most reliable signals come from combining Bollinger Bands with indicators like RSI, MACD, trading volume, and price action.
Does touching the lower Bollinger Band mean it’s time to buy?
Not necessarily. A price touching the lower band doesn’t automatically signal a buying opportunity. During strong downtrends, the price can continue falling while hugging the lower band. Wait for confirmation from bullish candlestick patterns, increased buying volume, or momentum indicators before entering a trade.
Should I sell when the price reaches the upper Bollinger Band?
No. In strong bullish trends, the price can remain near or above the upper Bollinger Band for an extended period. Selling immediately may cause you to exit profitable trades too early. Instead, look for signs of weakening momentum, bearish divergence, or nearby resistance.
What does a Bollinger Band Squeeze tell traders?
A Bollinger Band Squeeze occurs when the bands move closer together, indicating that market volatility has decreased. Traders watch for squeezes because they often precede significant price movements. However, the squeeze only signals that volatility may increase—it doesn’t predict whether the breakout will be bullish or bearish.
How can I avoid false Bollinger Band signals?
False signals are common, especially in sideways markets. Instead of reacting to every touch or breakout, wait for confirmation from trading volume, RSI, MACD, support and resistance levels, or candlestick patterns. Combining multiple indicators can significantly improve trade quality.
What are the best Bollinger Band settings for cryptocurrency?
The standard settings of a 20-period Simple Moving Average (SMA) with two standard deviations work well for most traders and markets. While some short-term traders adjust these settings for faster signals, it’s important to backtest any changes before using them in live trading.
Should I use Bollinger Bands with RSI or MACD?
Yes. Bollinger Bands measure volatility, RSI measures momentum, and MACD helps identify trend direction. Using these indicators together provides stronger confirmation and helps filter out lower-quality trading signals.
Are Bollinger Bands better for day trading or swing trading?
Bollinger Bands are versatile enough for both day trading and swing trading. Day traders often use them to identify breakout opportunities during periods of low volatility, while swing traders use them to spot trend reversals, pullbacks, and continuation setups over several days or weeks.
Why does the price sometimes move outside the Bollinger Bands?
Price moving outside the bands usually indicates unusually strong momentum or increased volatility. It doesn’t automatically mean the market will reverse. In trending markets, especially cryptocurrencies, the price can remain outside the bands for several candles before eventually pulling back.
Can Bollinger Bands predict the next Bitcoin or crypto pump?
No. Bollinger Bands cannot predict future price movements with certainty. They can identify periods of low volatility that often precede large moves, but traders still need confirmation from market structure, trading volume, momentum indicators, and overall market sentiment before entering a position.
 ABOUT THE AUTHOR
See More
ABOUT THE AUTHOR
See More


Sidebar rates

