DAX: Key Support Levels and Mixed Signals Point to Potential Downside Risk

The German DAX index has entered a corrective phase over the last seven weeks, reflecting broader market uncertainties. After an extended bullish trend earlier in the year, the index is now approaching a key support level. The critical question is whether the DAX will find sufficient buying interest at this support to resume its upward momentum or continue its downward trajectory.
Weakening Bullish Momentum In The Monthly Chart
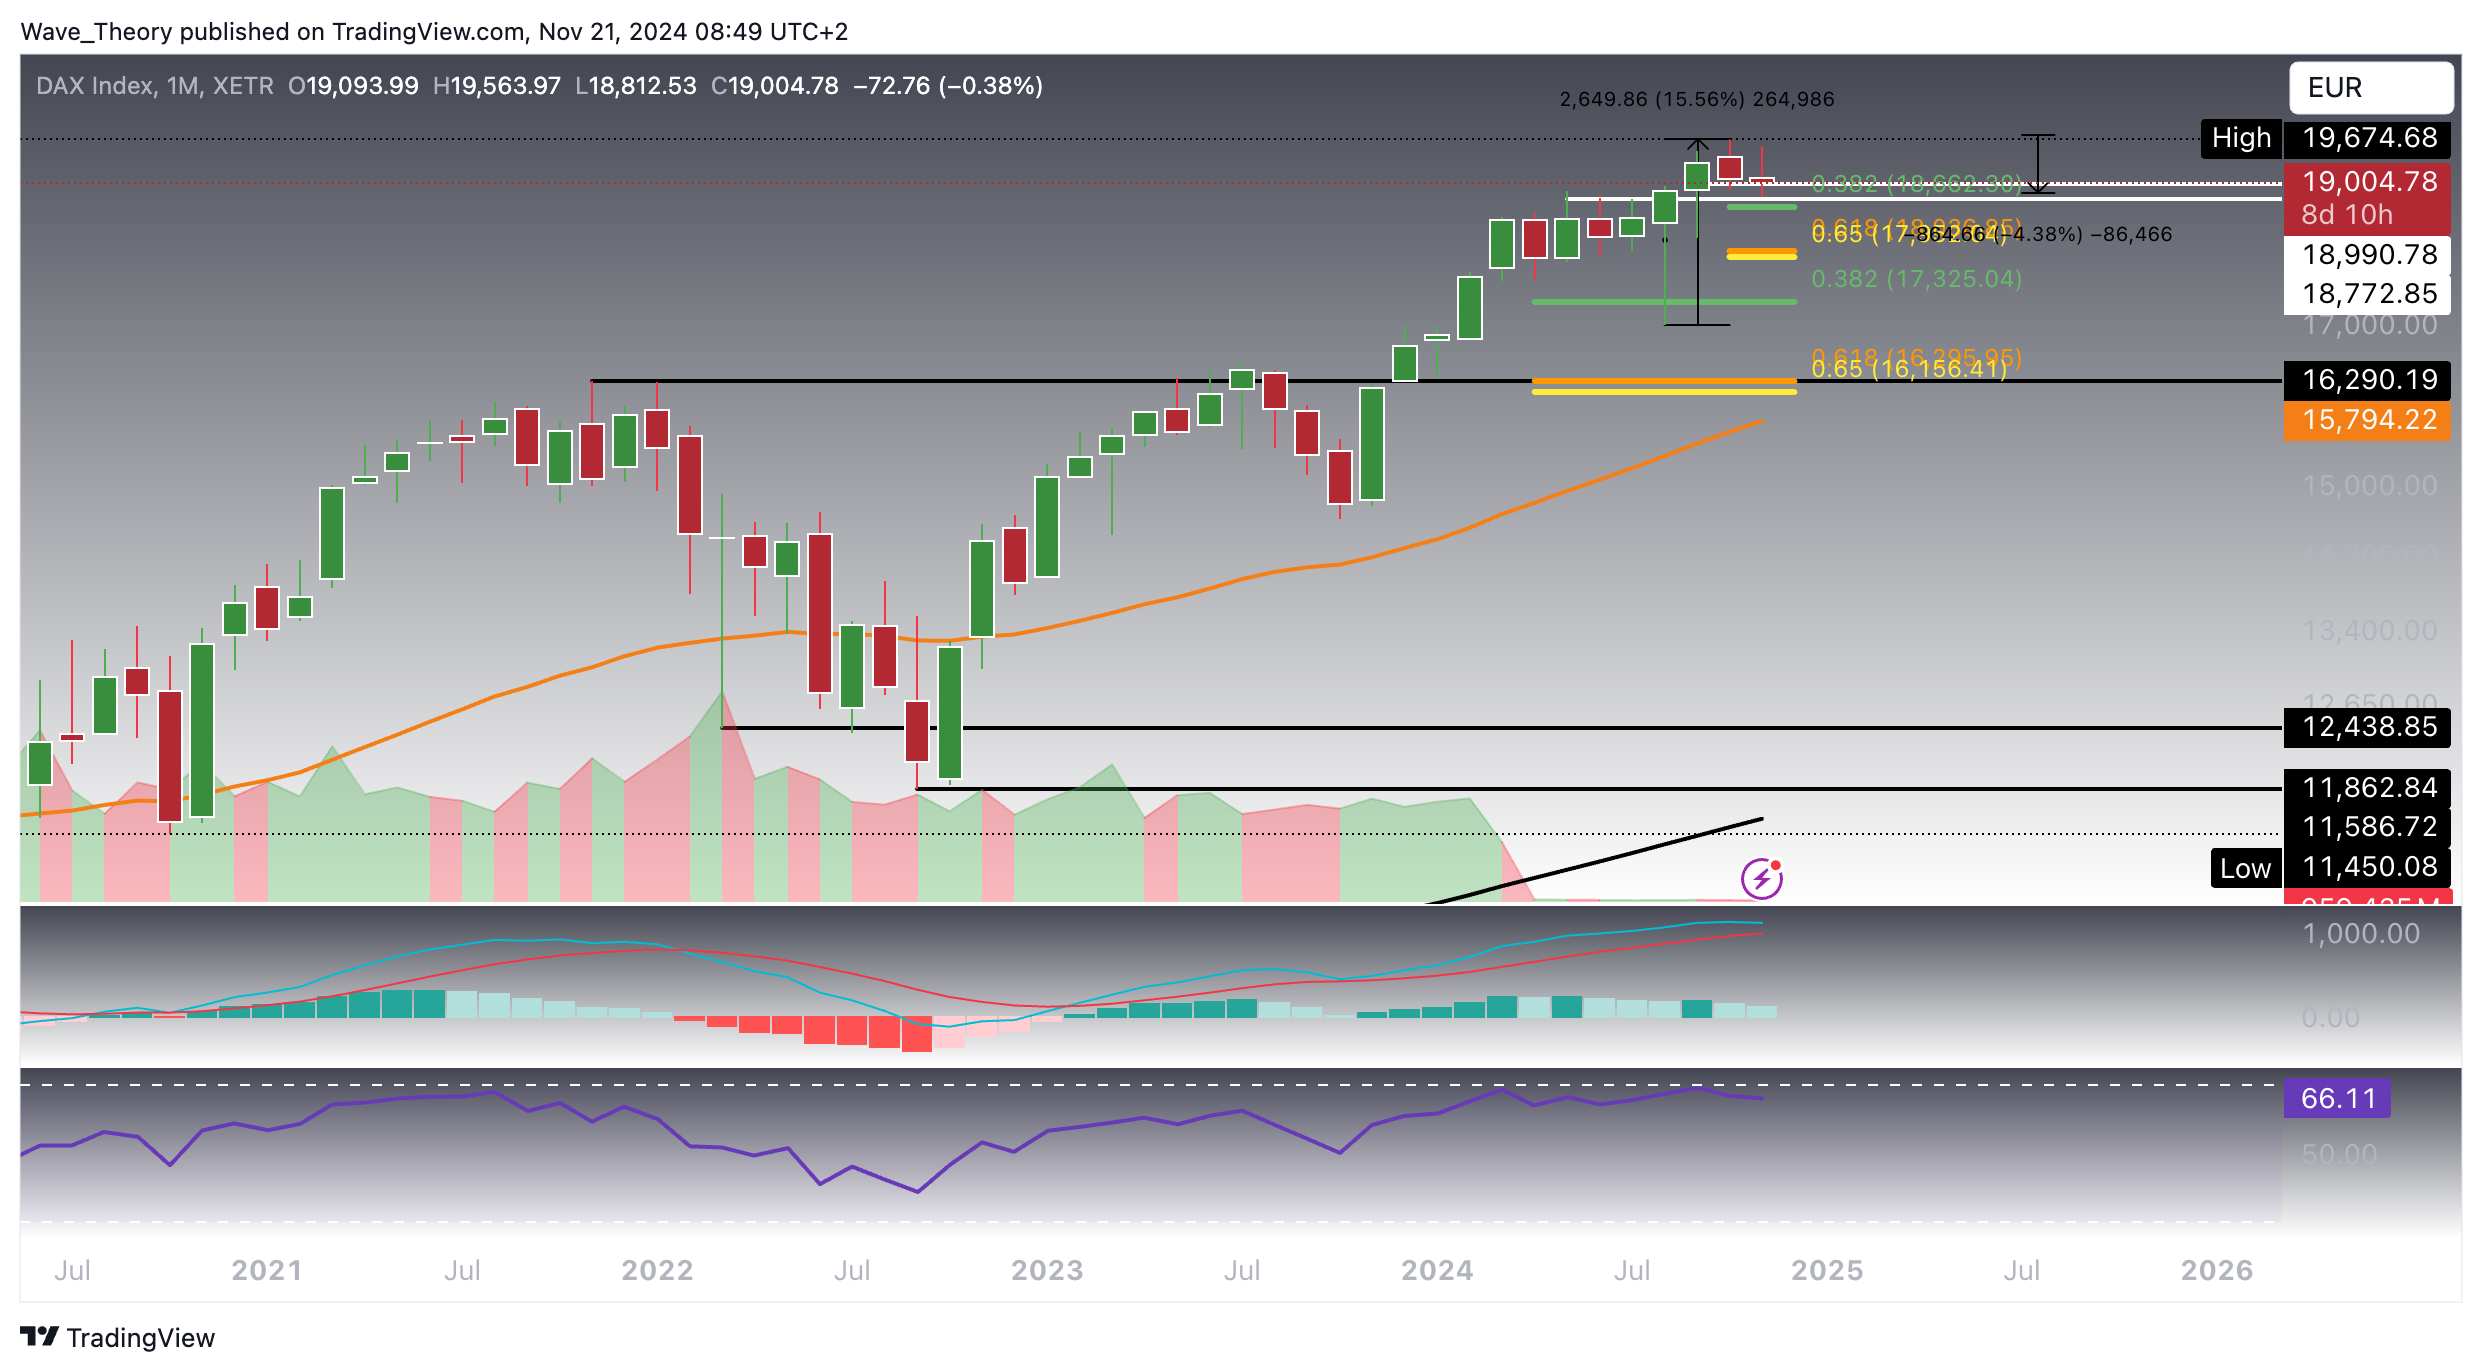
The DAX recently hit a high of 19,675 last month but has since undergone a 4.5% correction, bringing it down to a support zone between 18,773 and 18,990. This correction is still part of a broader bullish trend, but the index is now testing key support levels. Should DAX break below this zone, it could potentially target the next Fibonacci levels at 18,662 and 18,000, respectively.
In the monthly chart, indicators show mixed signals. On the bullish side, the MACD lines remain crossed bullishly, and the EMAs still present an intact golden crossover, reinforcing the long-term bullish trend. However, caution is warranted as the MACD histogram has been ticking lower for the past month, suggesting momentum is weakening. Additionally, the RSI is nearing overbought territory, indicating that the index may be at risk of further correction if buying interest does not hold at the current support.
For now, the corrective phase appears intact, but the DAX is at a crucial support zone that will determine whether it continues its upward trend or faces deeper downside risks.

Weekly Chart Outlook: Bearish
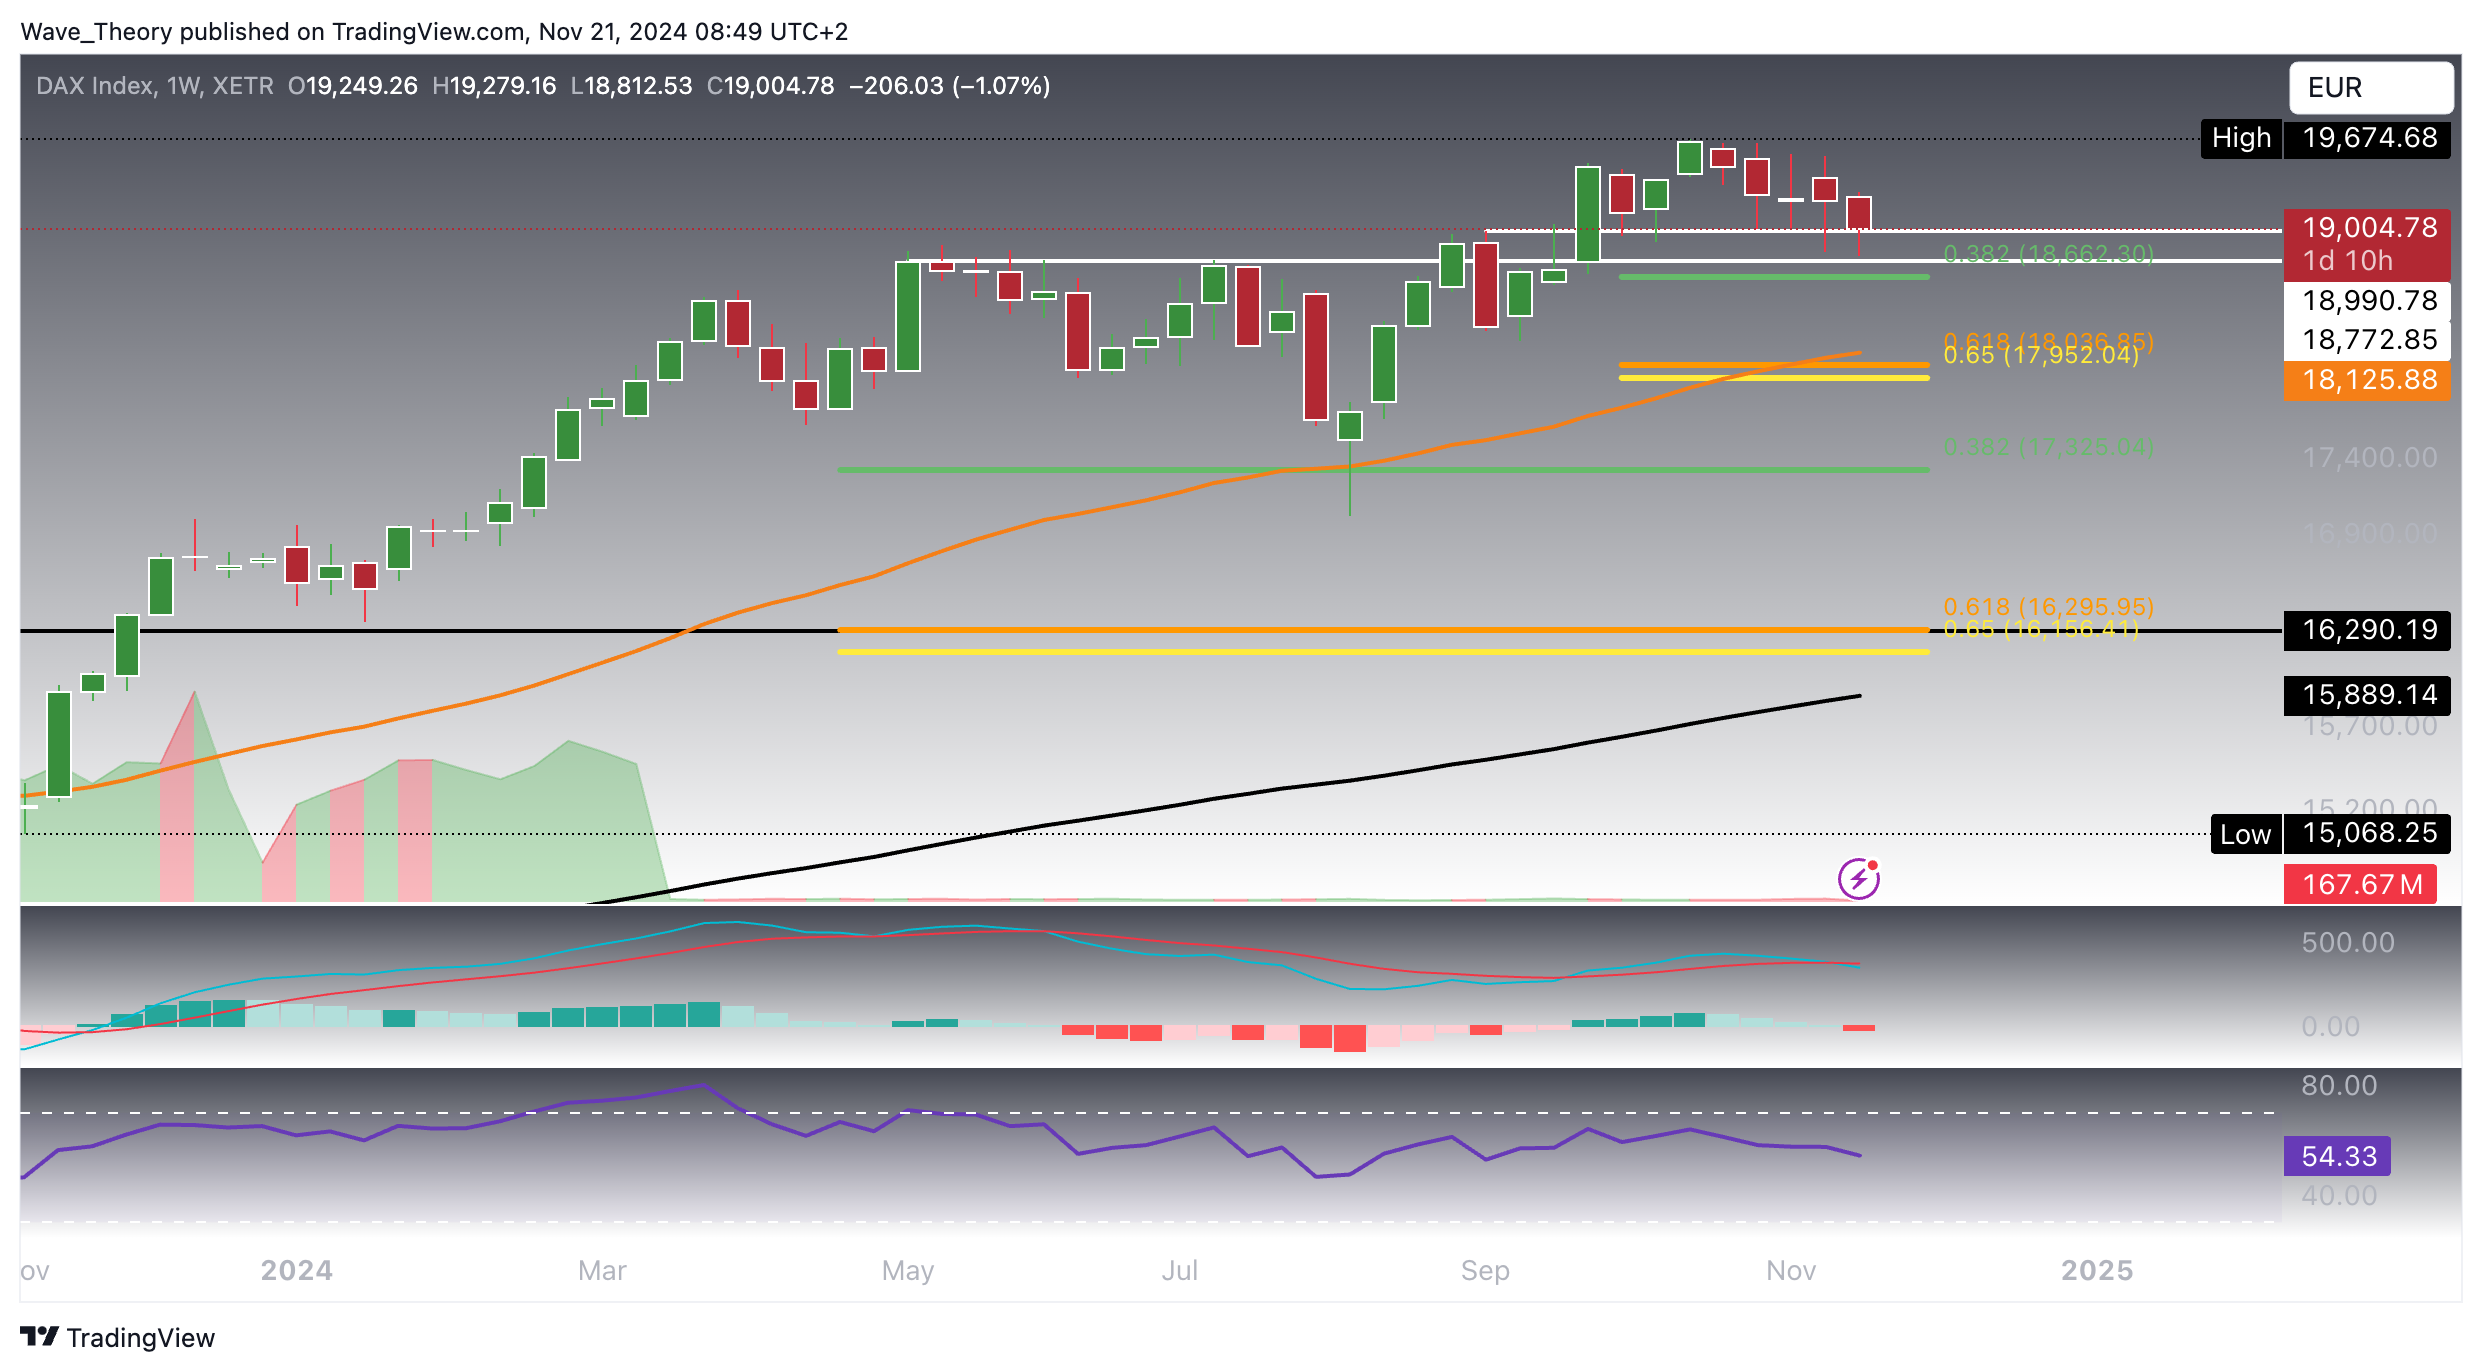
The weekly chart for the DAX has displayed a bearish trend over the past five weeks, further confirmed by the bearish MACD lines and a downward-moving MACD histogram. This suggests that the DAX is still in a corrective phase. However, the index now approaches a major support zone, which presents an opportunity for a bullish bounce. If DAX does rebound, it could potentially re-test its previous high of 19,675.
Despite the recent downturn, the RSI remains in neutral territory, signaling neither overbought nor oversold conditions. Additionally, the EMAs maintain a bullish crossover, confirming that the mid-term trend remains upward. Should the index continue to correct, significant support lies at the golden ratio of 18,000, bolstered by the 50-week EMA at 18,126, making this a key level to watch for any further downside.

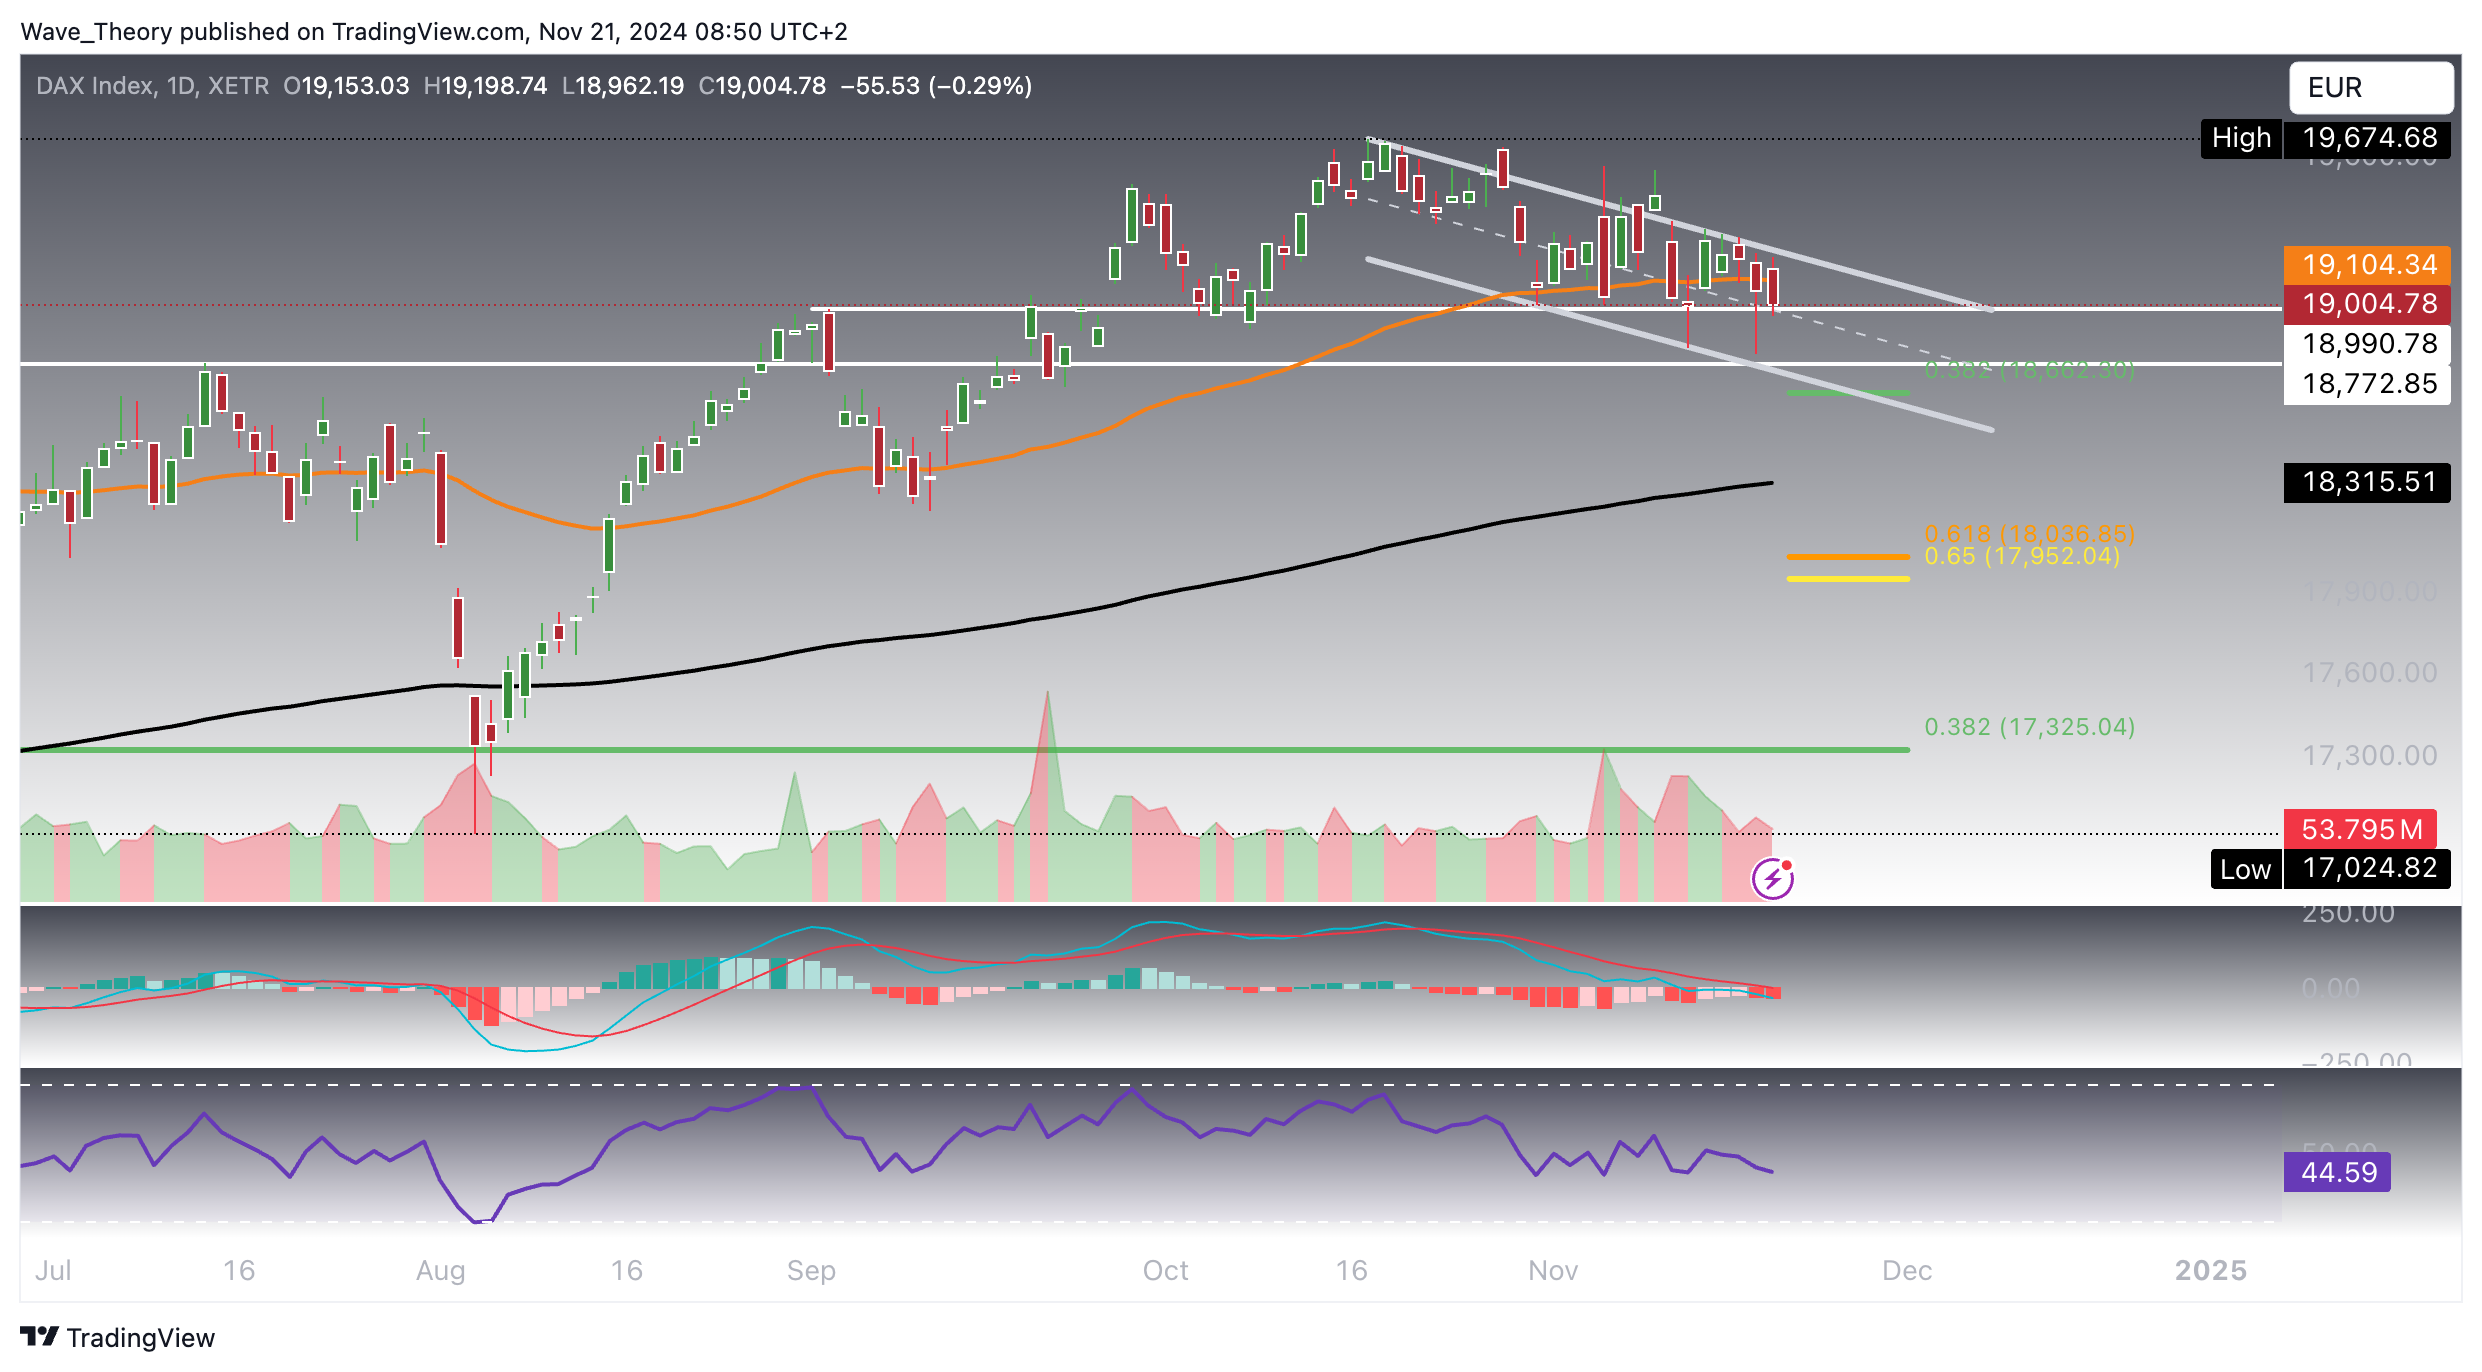
DAX at Risk of Further Downside: Parallel Downward Channel
Technical Indicators and Trends (Daily Chart):
- MACD: The MACD lines are crossed bearishly, and the histogram has been ticking lower since yesterday, signaling a short-term bearish trend.
- RSI: The RSI remains in neutral territory, not indicating either overbought or oversold conditions.
- EMA: Despite the current downtrend, the EMAs maintain a golden crossover, indicating that the broader trend is still bullish in the short- to medium-term.
This technical setup implies that while DAX could face near-term downside risks, these strong support levels may prevent a deeper correction. If the index stabilizes around these levels, it could present an opportunity for a renewed bullish move in the mid-term.

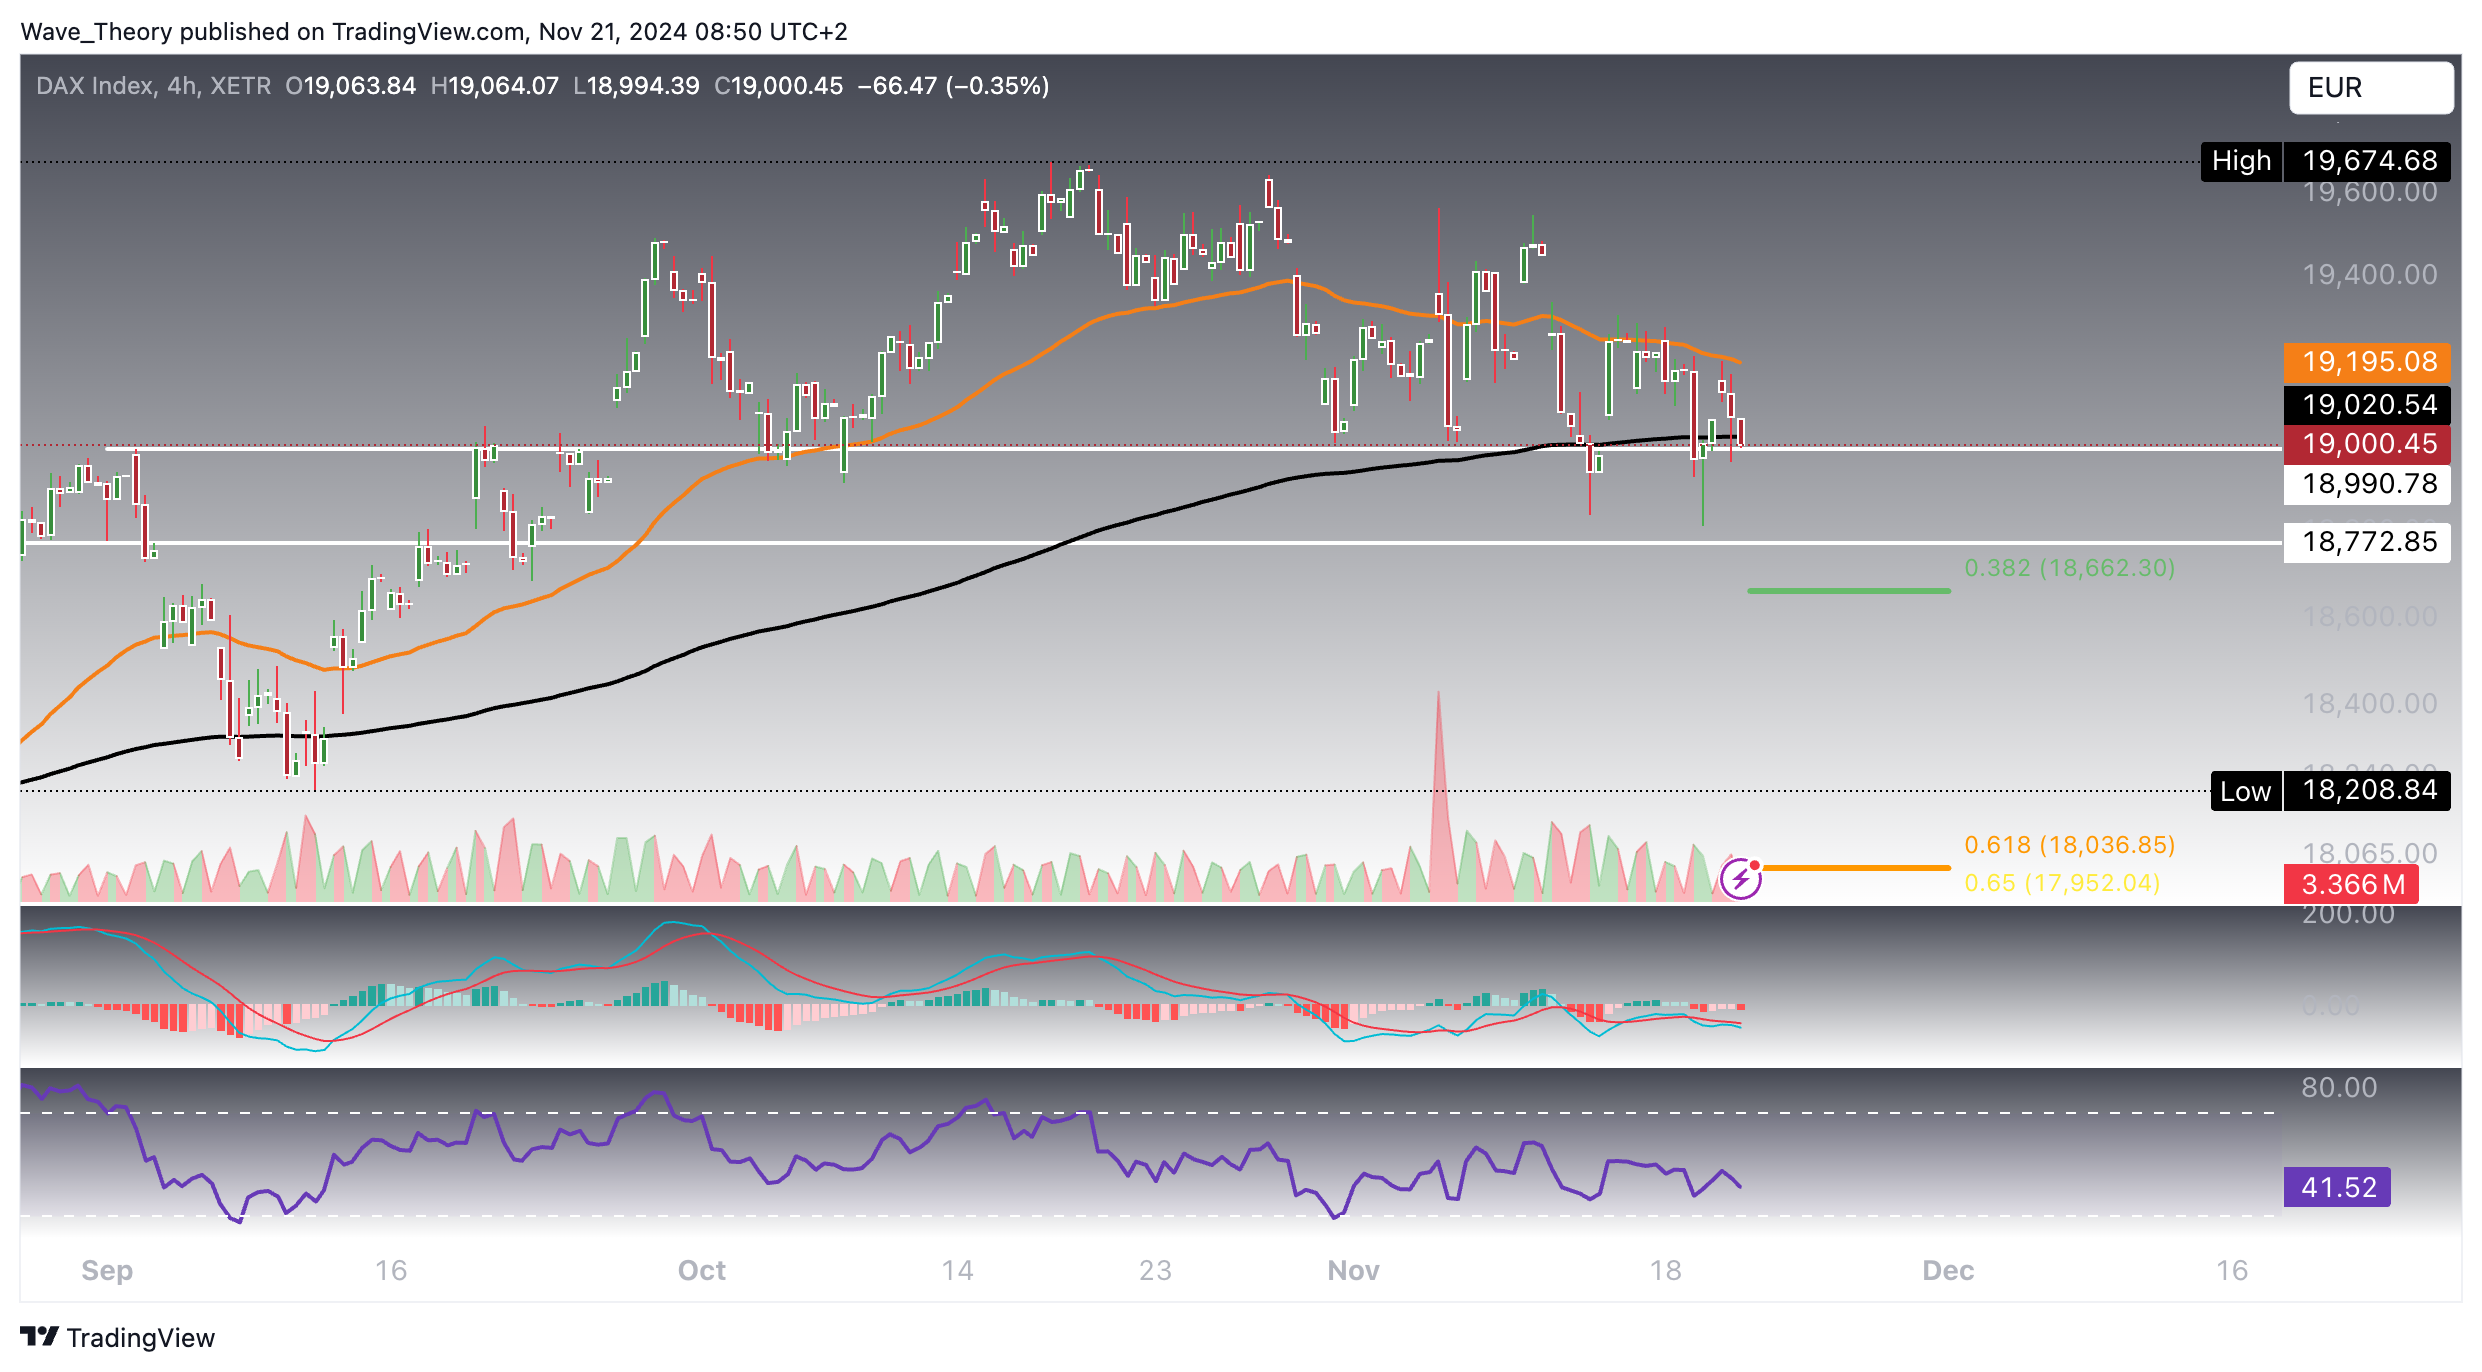
4H Chart Indicates Potential Death Cross for DAX Amid Bearish MACD Signals
In the 4H-Chart, the RSI remains in neutral territory, indicating neither overbought nor oversold conditions. However, the MACD lines are bearishly crossed, and the histogram continues to tick lower, further confirming short-term bearish momentum.
Despite this, the EMAs are still in a bullish crossover, suggesting that the broader trend remains positive for now. However, if the downtrend persists, there’s a risk of a death cross forming, which would signal a more pronounced bearish shift in the market’s direction.

In conclusion, the DAX index is currently navigating through a complex technical landscape. The golden crossover in the EMAs supports a bullish outlook in the mid- to long-term, yet the bearish MACD and neutral RSI are signaling potential short-term downside risk. While the index is near significant support zones, suggesting a possible bounce or stabilization, the ongoing bearish MACD histogram and recent price action point toward the likelihood of further downside before a clearer upward trend materializes. Traders should remain cautious, monitoring support levels between 18,773 and 18,990, and await further momentum indicators for confirmation before committing to a directional position.
- Check out our free forex signals
- Follow the top economic events on FX Leaders economic calendar
- Trade better, discover more Forex Trading Strategies
- Open a FREE Trading Account

