Gold Dips on Dollar Strength—Can Bulls Reclaim $3,350?
Gold prices inched lower on Friday, caught in a tug-of-war with a modest 0.2% rise in the U.S. dollar index (DXY).

Quick overview
- Gold prices dipped slightly due to a 0.2% rise in the U.S. dollar index, keeping prices around $3,290–$3,300.
- Traders are awaiting the U.S. PCE inflation report, which is expected to show steady inflation, influencing Federal Reserve policy.
- Technical analysis indicates gold is tightening within a descending triangle, with key resistance at $3,326 and support at $3,286.
- Traders are advised to consider short positions below $3,286 and long positions above $3,326, based on current market signals.
Gold prices inched lower on Friday, caught in a tug-of-war with a modest 0.2% rise in the U.S. dollar index (DXY). This dollar strength makes gold more expensive for overseas buyers, keeping its price range tight around $3,290–$3,300. As traders await the U.S. personal consumption expenditures (PCE) price index report—a key inflation gauge for the Federal Reserve—the market is holding its breath for potential clues on Fed policy.
According to a Reuters poll, PCE inflation is expected to hold steady at 0.1% month-on-month, with a 2.2% year-on-year increase. On Thursday, San Francisco Fed President Mary Daly hinted that while rate cuts are possible later this year, the Fed prefers to maintain a steady course for now. This cautious approach is capping gold’s upside.
Adding to the complexity, a federal appeals court briefly reinstated tariffs imposed by former President Donald Trump, sparking renewed market uncertainty. Trade talks with China are dragging on, with U.S. Treasury Secretary Scott Bessent suggesting that a direct meeting between Trump and Xi Jinping might be needed to break the deadlock.
Technical Picture: XAU/USD Tightens into a Key Range
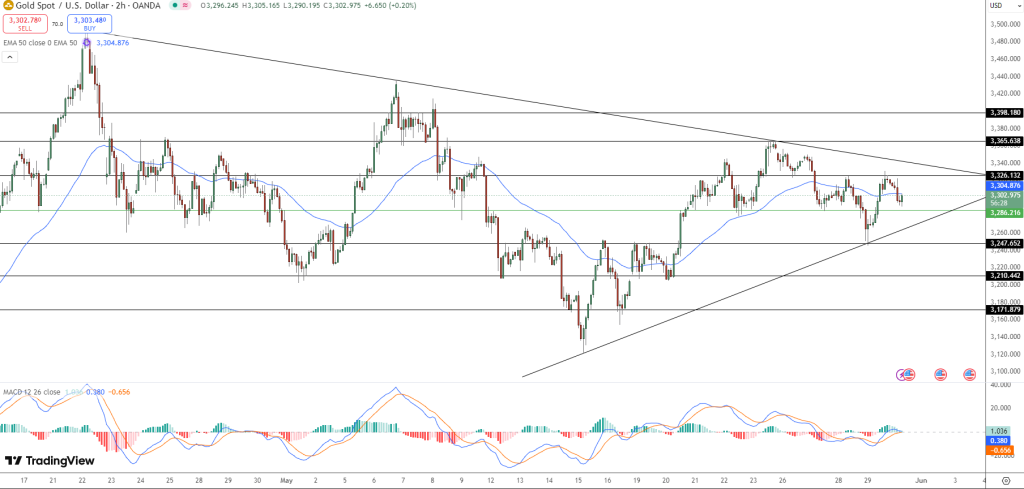
Gold’s price action is tightening within a descending triangle on the 2-hour chart, with resistance near $3,326 and a rising trendline offering support around $3,286. The chart is showing multiple spinning tops and doji candles near resistance, reflecting indecision. Meanwhile, the MACD histogram leans bearish, with deepening red bars signaling potential downside.
-
50-EMA resistance: $3,304
-
Key support: $3,286
-
Immediate resistance: $3,326
A break below $3,286 could trigger a sharp drop to $3,248 or even $3,210, which align with historical support levels. On the flip side, a breakout above $3,326, confirmed by a bullish engulfing candle, might pave the way for a run to $3,366 or even $3,398.
Trade Setup: How to Navigate the Breakout or Breakdown
For traders looking to play this setup:
-
Short Setup: Enter below $3,286, with a stop above $3,304, targeting $3,248.
-
Long Setup: Enter above $3,326, with a stop under $3,286, targeting $3,366 or higher.
This setup blends trendlines, EMA resistance, candlestick patterns, and MACD signals, offering a precise playbook for both breakout and breakdown scenarios.
- Check out our free forex signals
- Follow the top economic events on FX Leaders economic calendar
- Trade better, discover more Forex Trading Strategies
- Open a FREE Trading Account