WTI Crude Drops to $69 as Tariff Shock and Supply Glut Weigh on Oil Markets
WTI crude oil futures slipped by nearly 3% on Thursday, falling toward $69 per barrel, as markets turned risk-averse following...

WTI crude oil futures slipped by nearly 3% on Thursday, falling toward $69 per barrel, as markets turned risk-averse following a surprisingly aggressive U.S. tariff announcement.

While the energy sector itself was spared—imports of oil, gas, and refined products remain exempt—the broader economic implications of the 10% baseline tariff, along with 34% on Chinese goods and 20% on EU imports, have triggered fresh concerns about slowing global demand.
Although oil isn’t directly targeted, the fear is clear: if tariffs slow growth and trade, energy consumption could take a hit.
Inventory Surprise and Russian Export Curbs Add to Market Uncertainty
Adding to the bearish tone, U.S. crude stockpiles unexpectedly rose by 6.165 million barrels last week, according to the latest EIA data. Markets had been expecting a draw of around 2 million barrels. The surge is largely being attributed to a jump in Canadian oil imports, catching many traders off guard.
On the international front, Russia has reportedly tightened export restrictions, halting loadings from several major ports—a move that could eventually support prices if the disruption is prolonged. But for now, supply jitters are being overshadowed by demand-side fears.
All eyes now turn to the upcoming OPEC+ meeting, where markets are hoping for fresh signals on output strategy amid growing volatility.
Technical Breakdown: Bulls Lose Ground Below $71
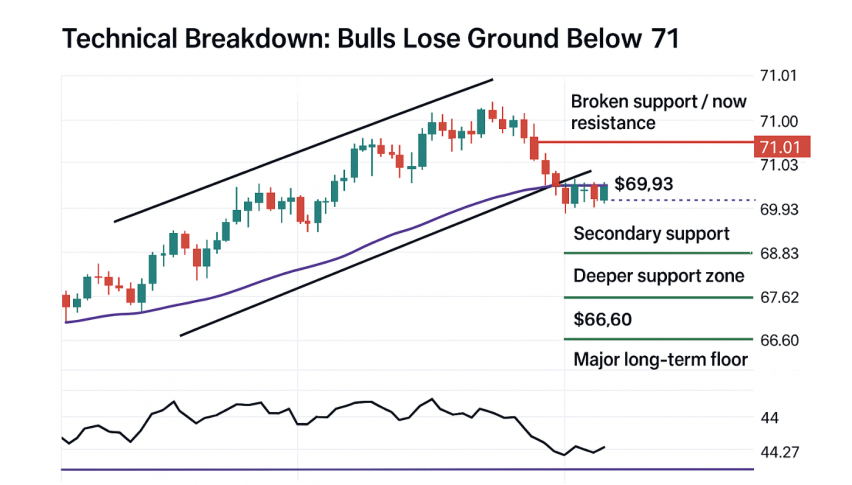
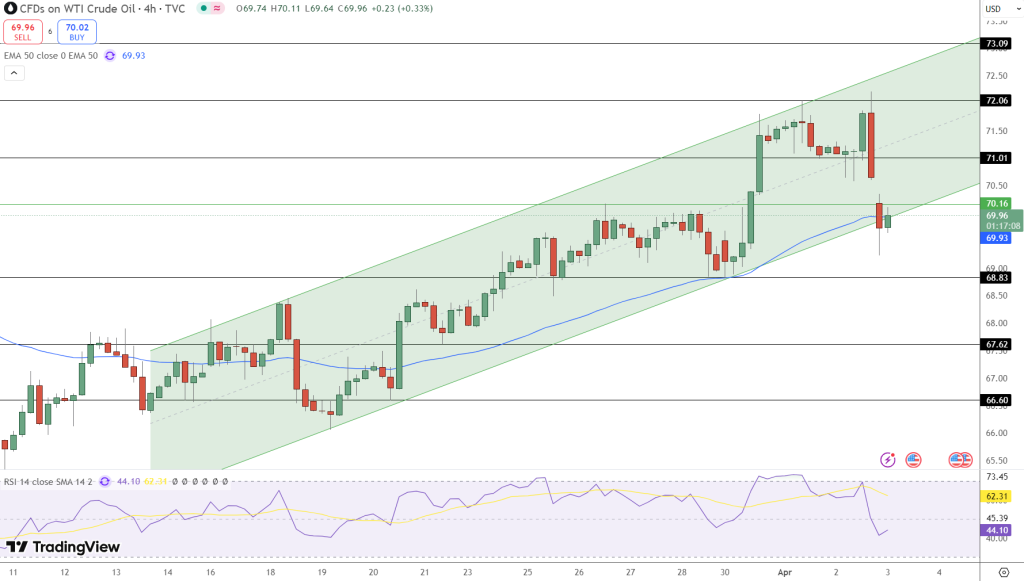
Technically, WTI crude has broken below its ascending channel, suggesting a shift in momentum after an earlier failed attempt to clear resistance at $72.06. Prices briefly pushed above $72 before reversing sharply, slipping below the channel’s lower boundary and testing dynamic support at the 50-period EMA, now sitting near $69.93.
This level is now acting as a key battleground between bulls and bears.
Key Technical Levels:
$71.01 – Boken support / now resistance
$69.93 – EMA / near-term support
$68.83 – Secondary support
$67.62 – Deeper support zone
$66.60 – Major long-term floor
The RSI has dropped to 44.27, reflecting fading buying strength. The indicator is now pointing lower and trading below its signal line, which reinforces the view that bearish momentum may continue—especially if bulls can’t reclaim the $71 level quickly.

Outlook: Pressure Mounts as Markets Await OPEC+
Unless sentiment shifts or OPEC+ delivers a production cut surprise, WTI may remain under pressure. The combination of macro headwinds, weakening technicals, and surprise builds in inventories suggests that near-term downside risks are growing.
For now, traders are watching the $68.83–$67.62 area for potential support. A sustained move below these levels could signal a deeper retracement—possibly toward the $66.60 floor.
- Check out our free forex signals
- Follow the top economic events on FX Leaders economic calendar
- Trade better, discover more Forex Trading Strategies
- Open a FREE Trading Account


