MicroStrategy Stock: Bullish Momentum Amid Short-Term Correction, Key Entry Points at $335 and $190
Bitcoin has ascended to become the seventh most valuable asset by market capitalization. This begs the question: could MicroStrategy, with its substantial BTC holdings, potentially emerge as one of the world’s most valuable companies?
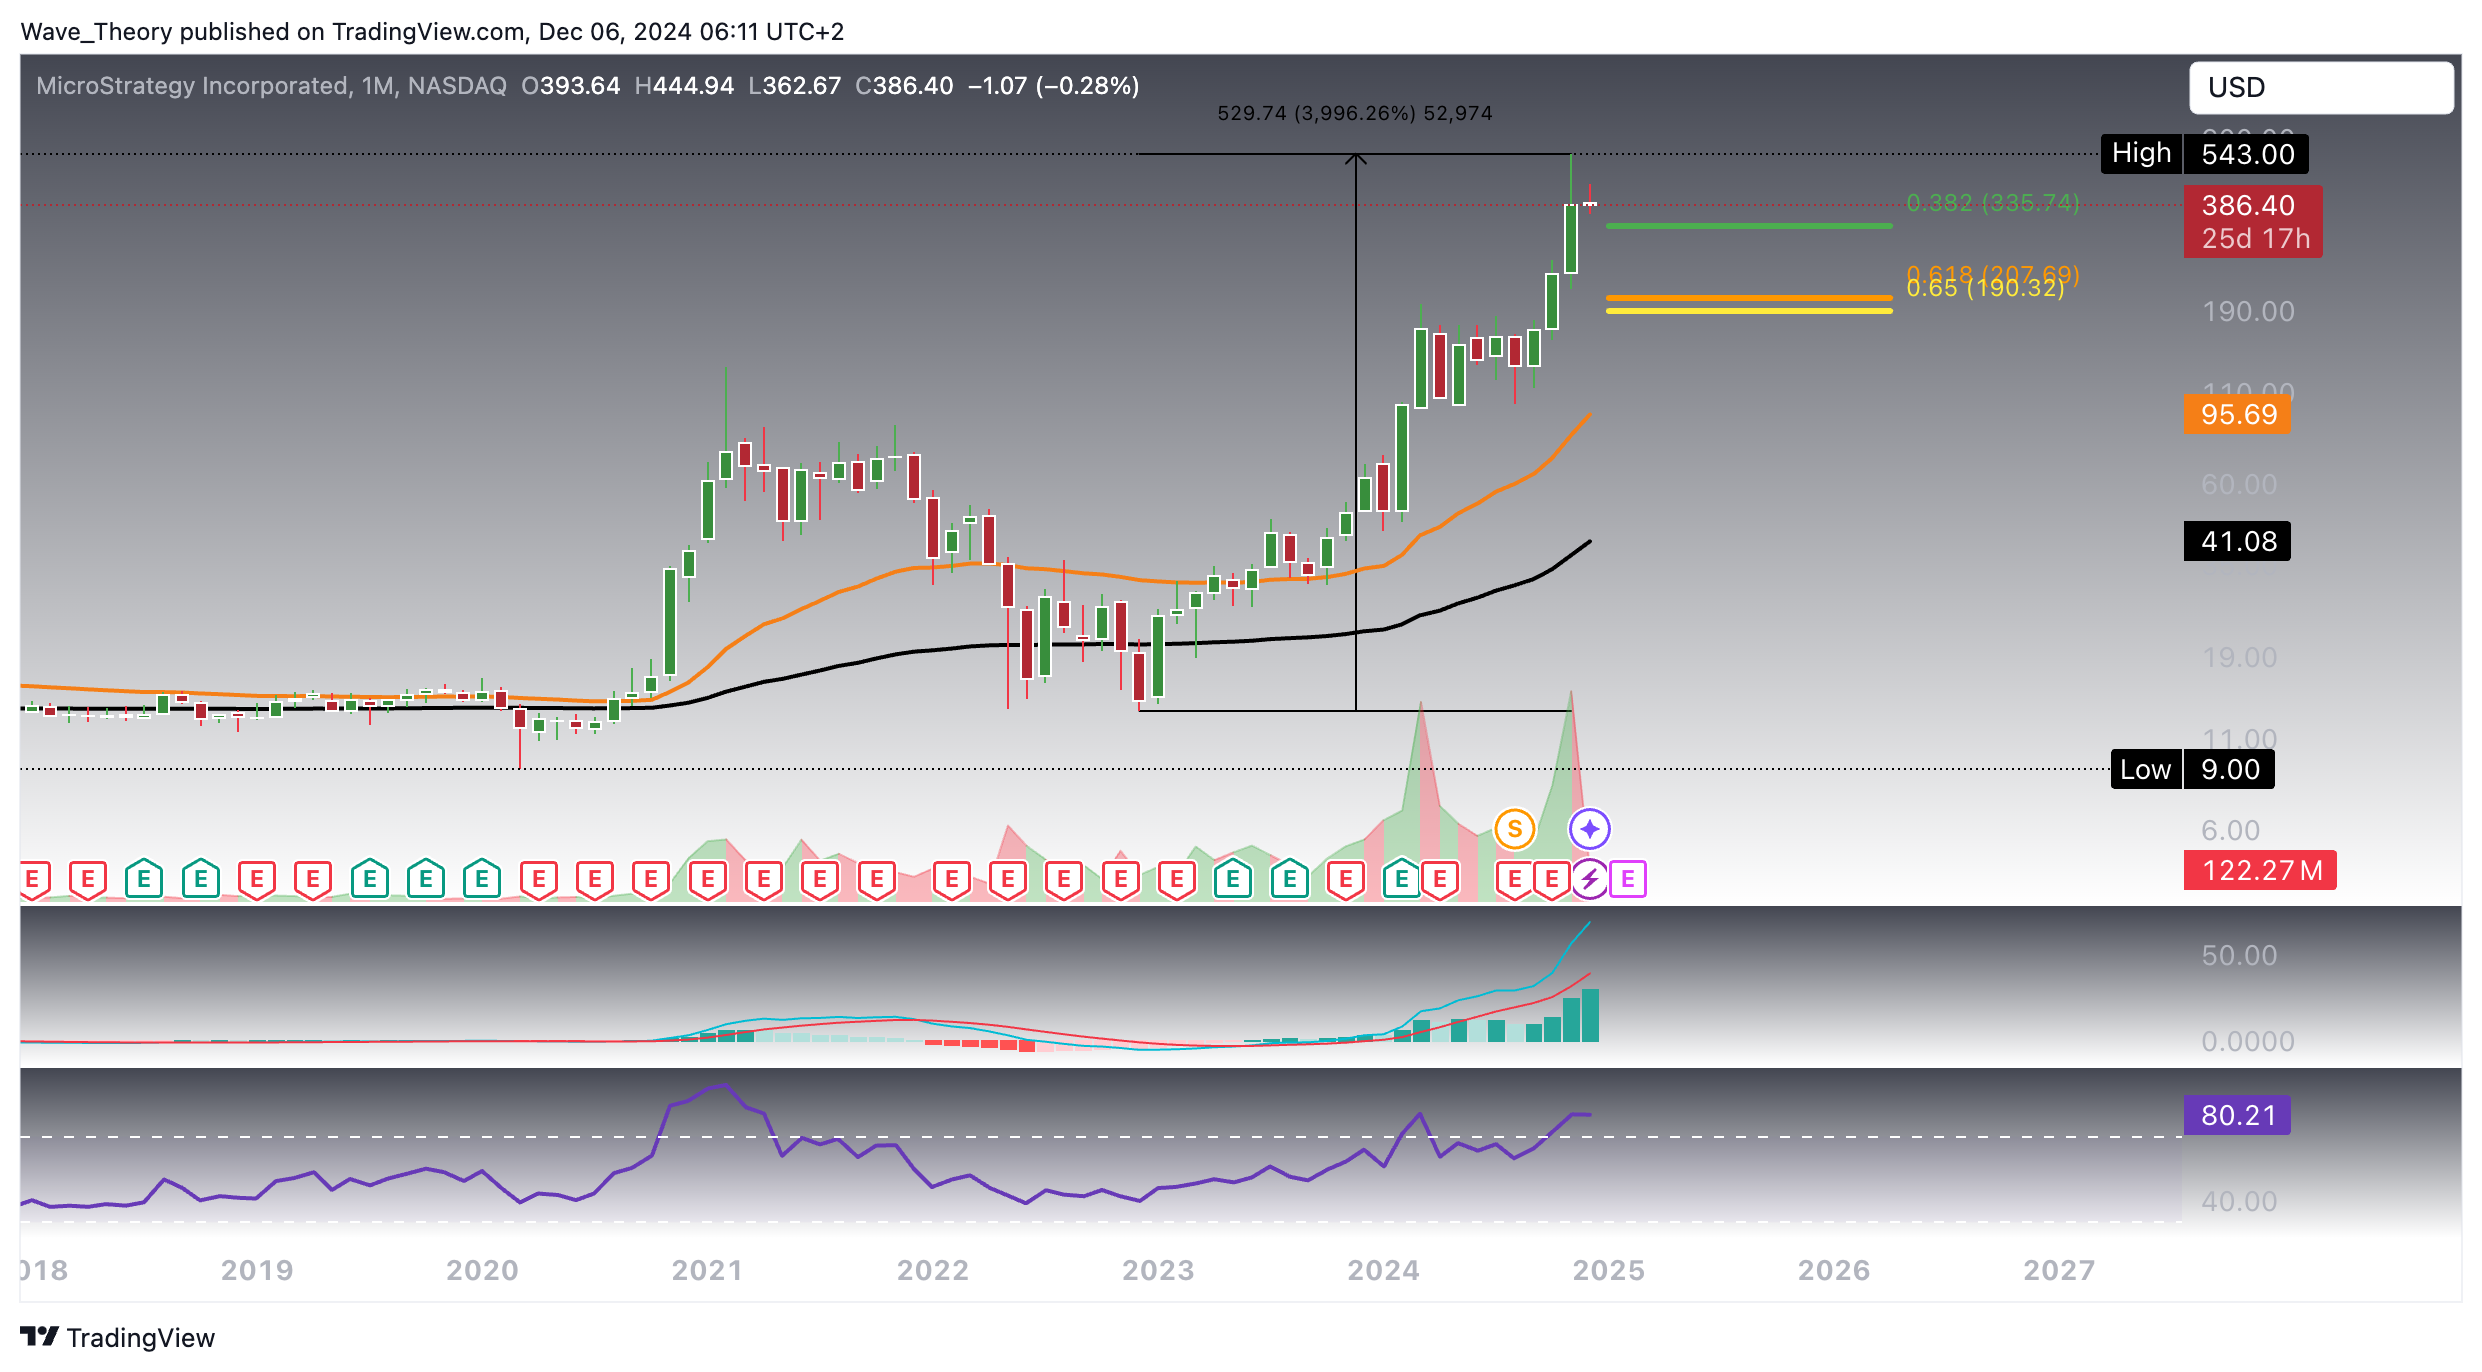
MicroStrategy (MSTR) Surged By Nearly 4,000 % Since 2023
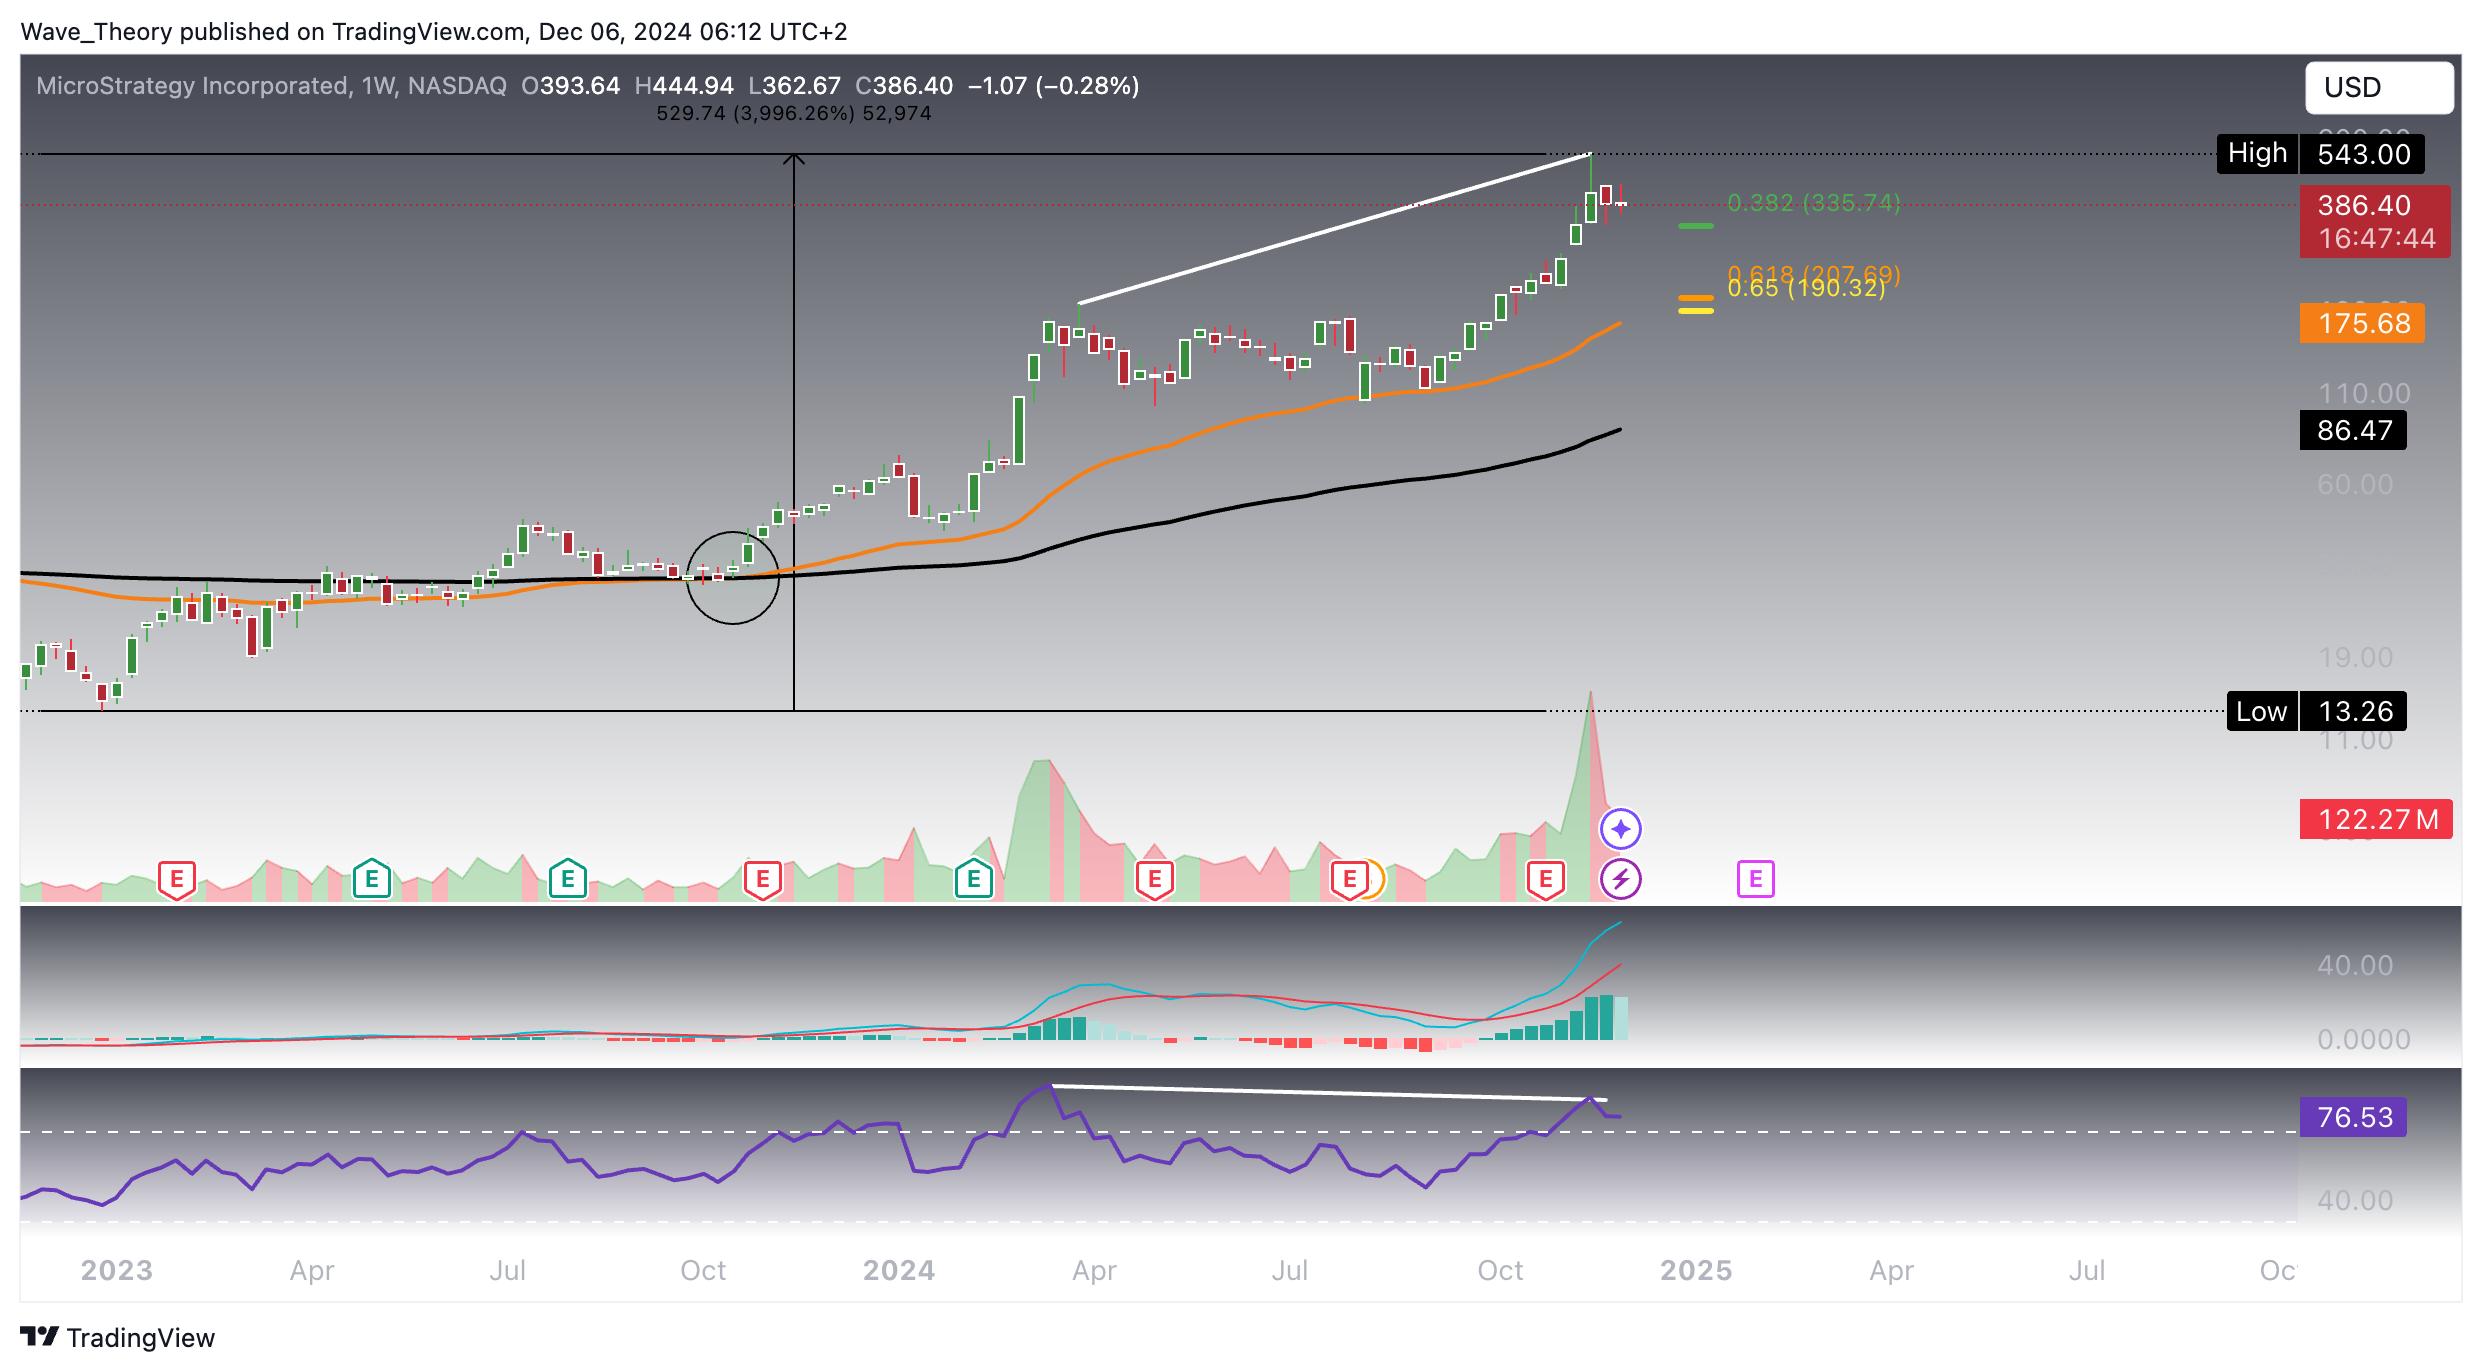
The Weekly Chart Signals Caution
Despite the bullish outlook on the monthly chart, the weekly chart introduces a more cautious tone.
- MACD Histogram: The histogram on the weekly chart appears to be ticking lower, indicating weakening bullish momentum and signaling a potential shift toward bearish sentiment.
- RSI: A significant bearish divergence in the RSI has emerged, suggesting that the price could be due for a correction after its parabolic rise.
In terms of support, MicroStrategy finds its next key Fibonacci levels at $336 and $190, which could serve as critical zones during a corrective phase.
However, it’s worth noting that after a potential correction, the stock may resume its upward trajectory. A golden crossover of the EMAs on the weekly chart confirms a mid-term bullish trend, and the MACD lines remain in a bullish formation, reinforcing the possibility of further gains once the correction has played out.
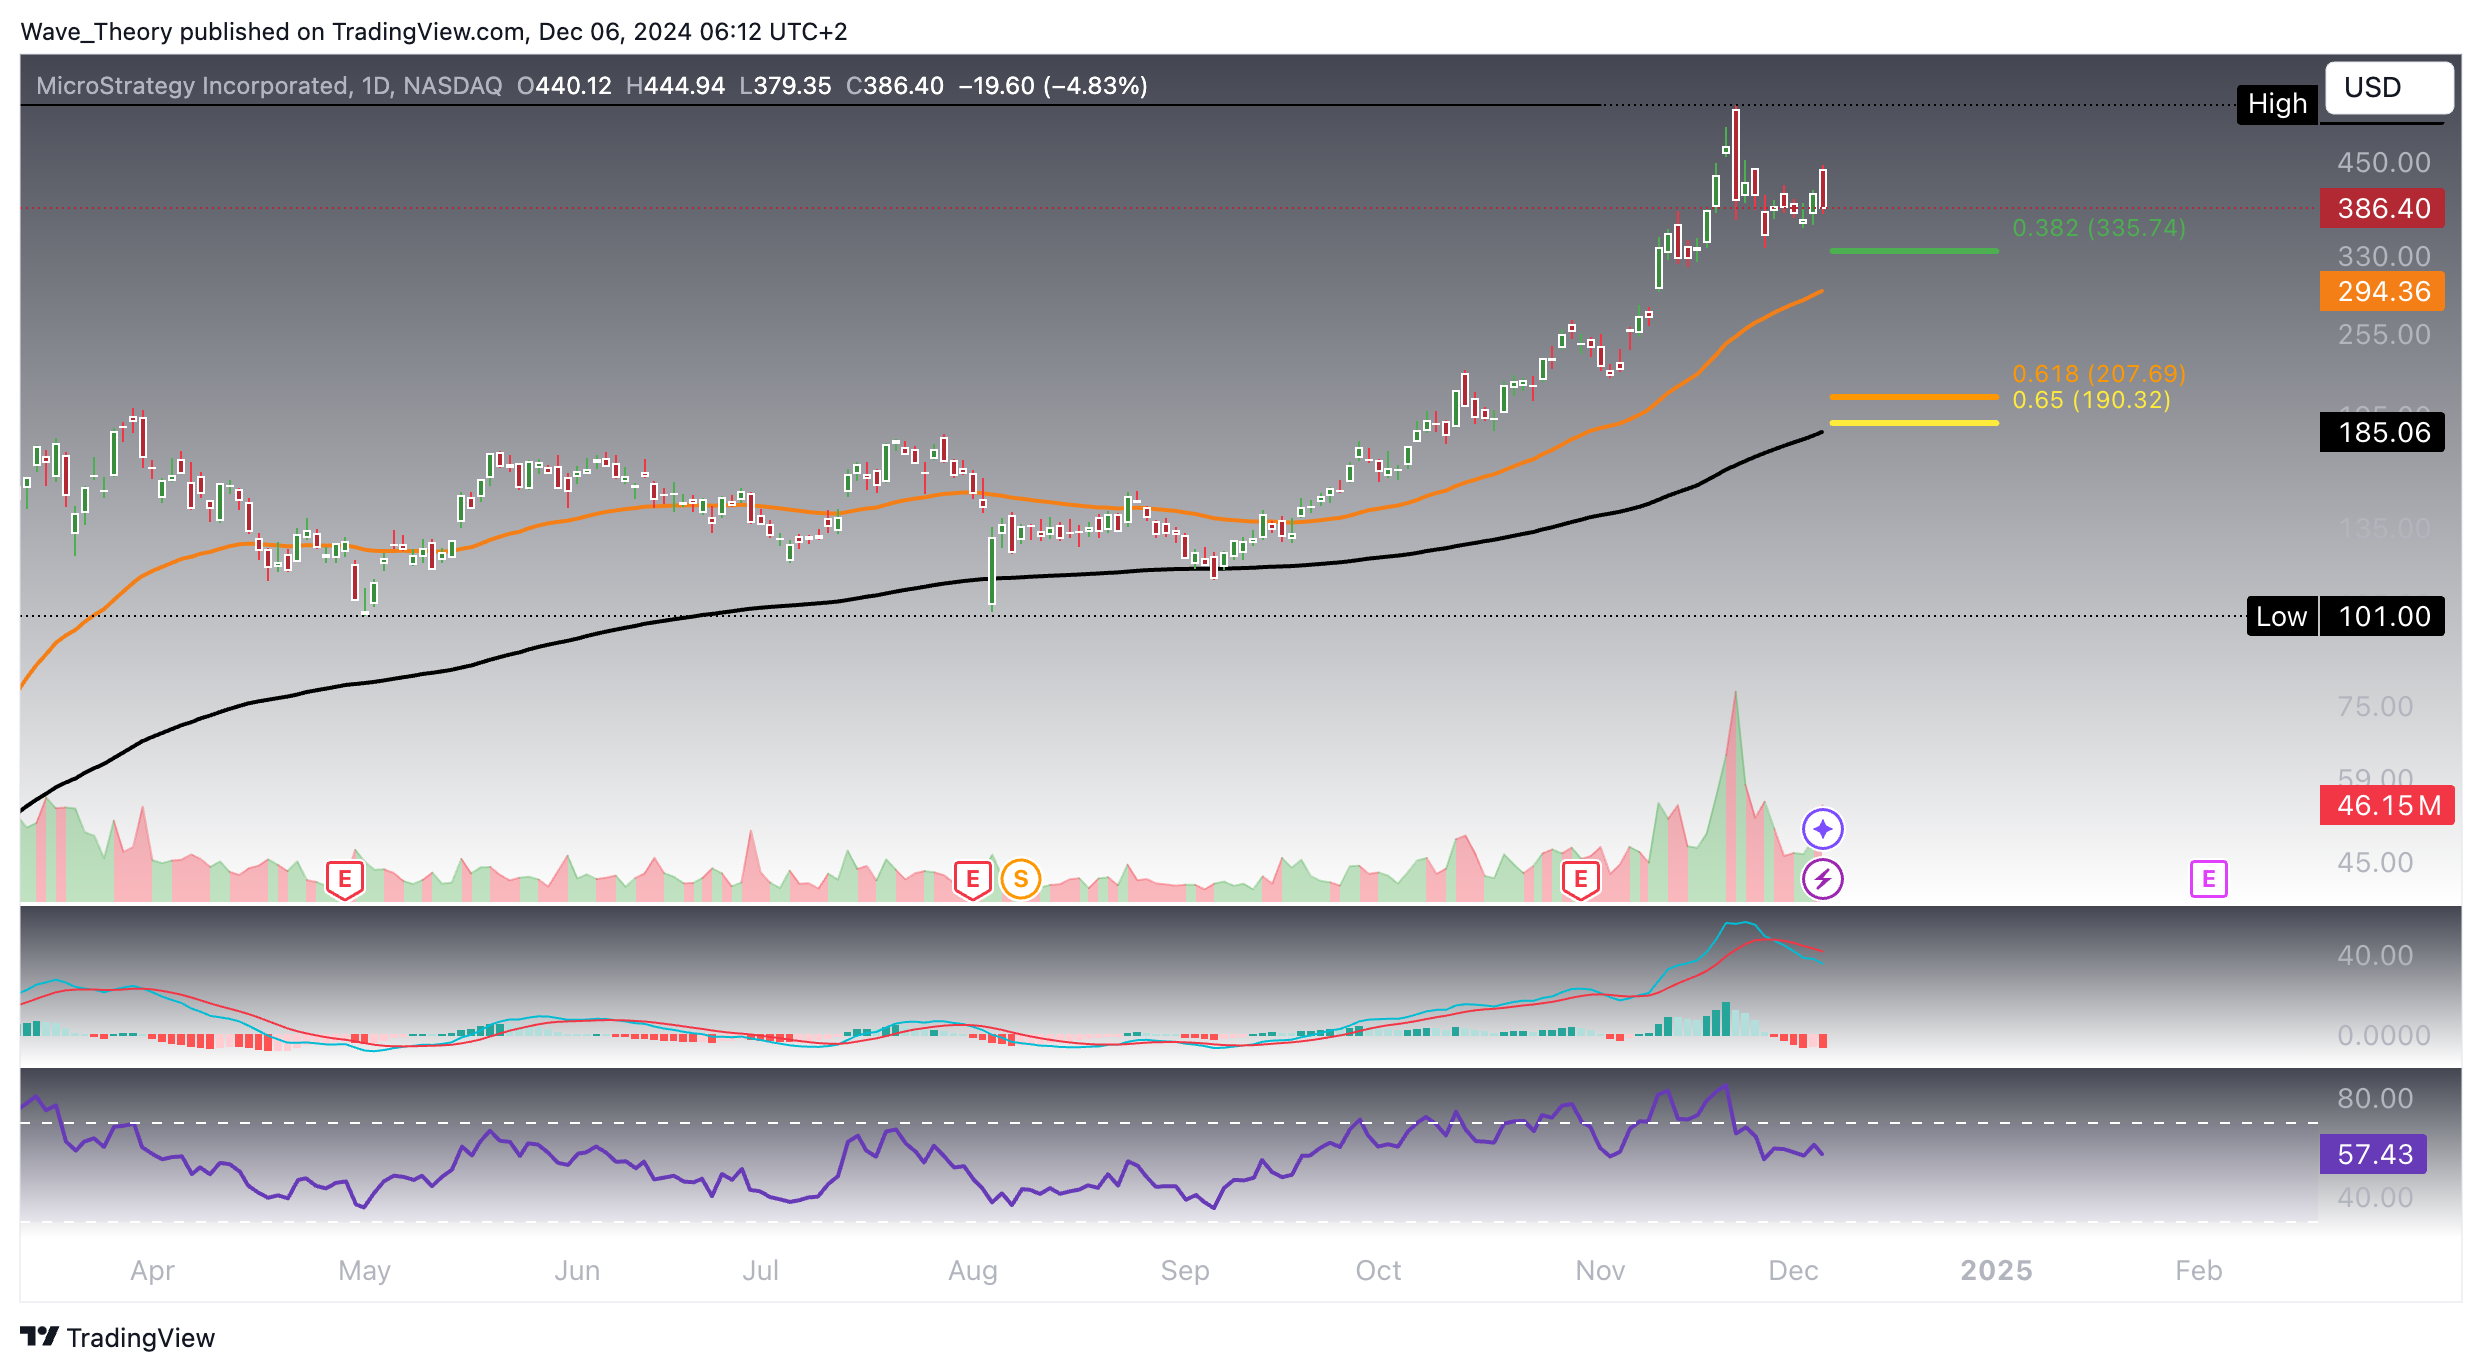
Mixed Signals On The Daily Chart
On the daily chart, MicroStrategy presents a blend of bullish and cautionary signals:
- Golden Crossover of EMAs: A bullish golden crossover has occurred, where the shorter EMA crosses above the longer EMA. This typically indicates strong upward momentum, suggesting potential gains in the short- to medium-term.
- RSI: The RSI currently holds a neutral position, not indicating overbought or oversold conditions. This suggests that the stock could move in either direction, depending on further developments.
- MACD: Despite the golden crossover, the MACD lines have crossed bearishly, with the histogram ticking lower. This signals a weakening bullish trend and hints at more downside potential in the short term.
Overall, while the golden crossover points to bullish momentum, caution is warranted as the MACD indicates possible short-term downside risk.
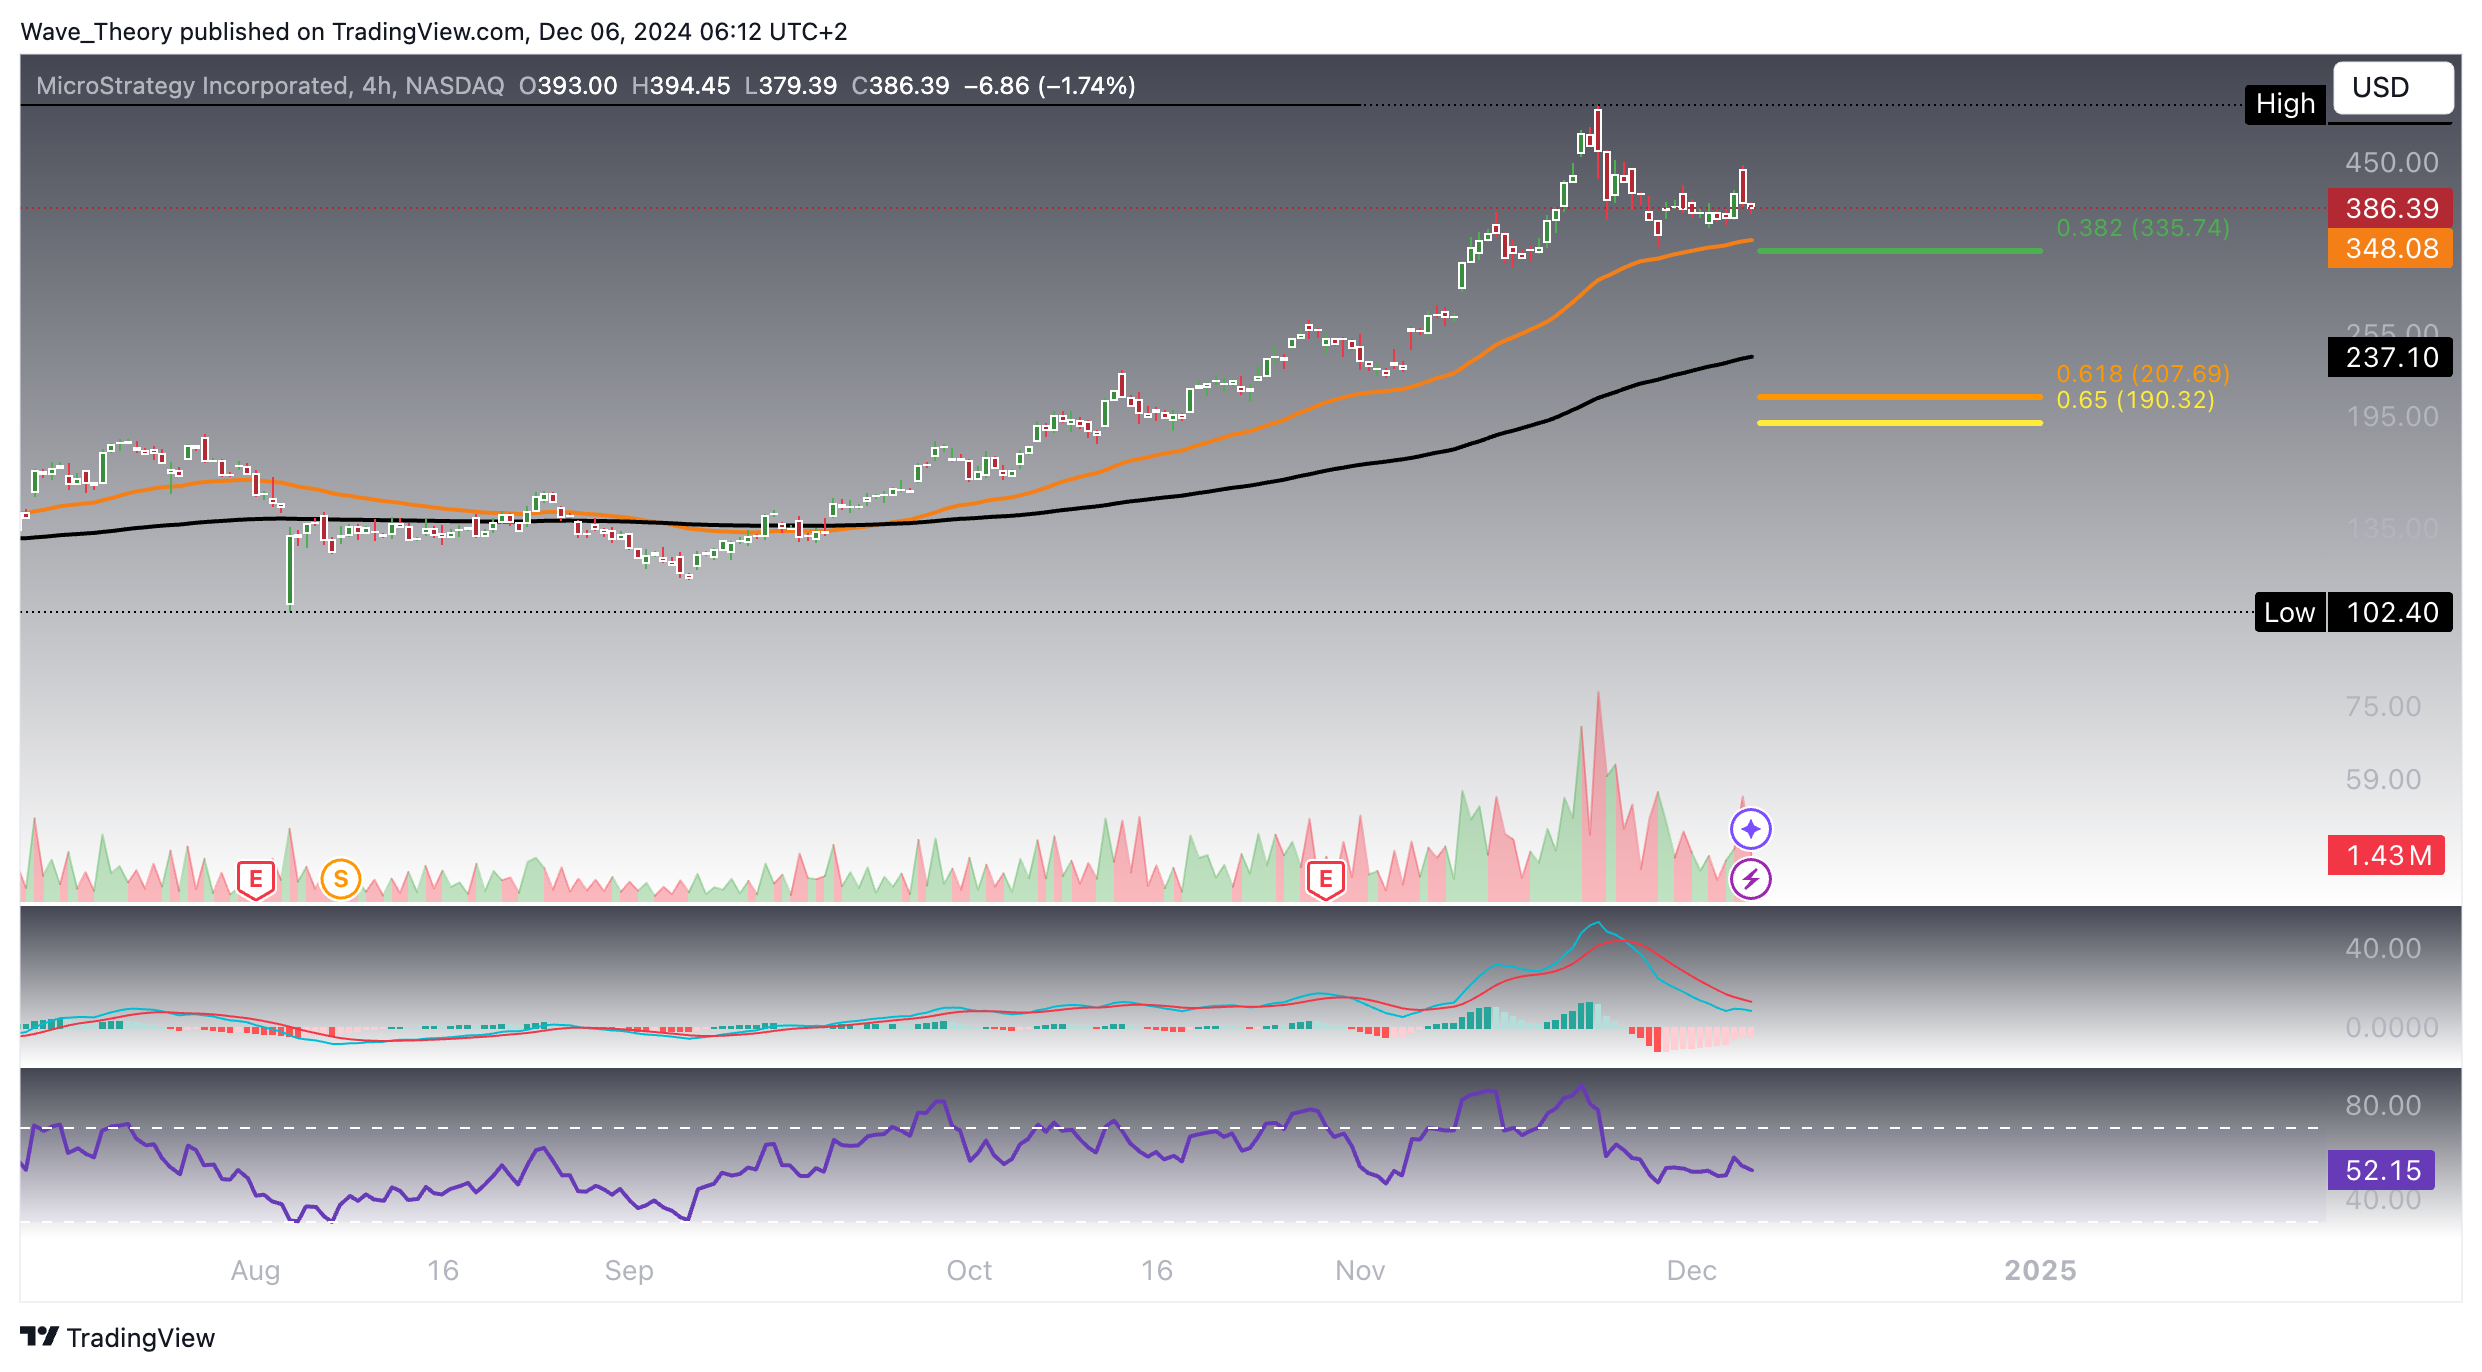
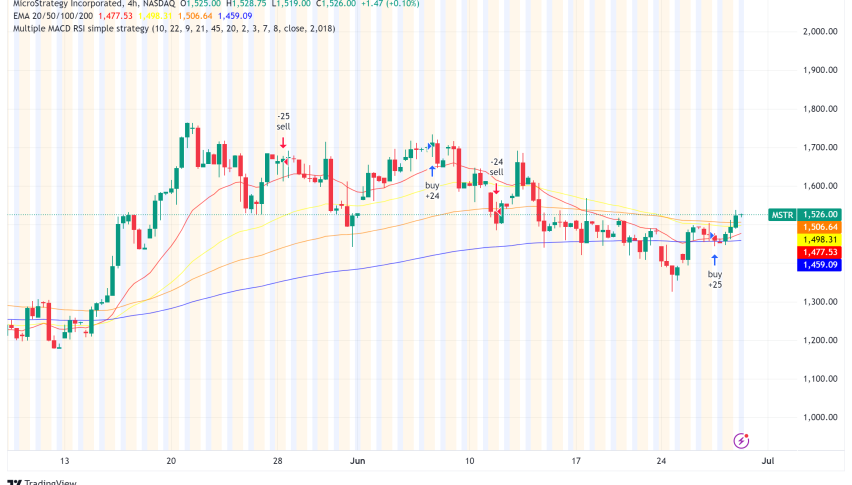
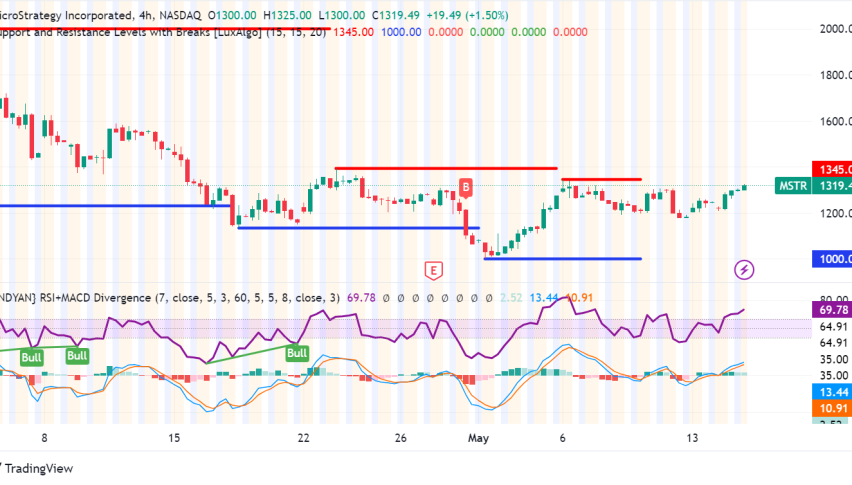
4H-Chart Echoes Mixed Signals, But Bearish in the Short-Term
On the 4-hour chart, MicroStrategy shows a similar setup, combining bullish signals with some cautionary elements:
- Golden Crossover: The presence of a golden crossover on the 4H chart aligns with short-term bullish momentum, confirming that the trend remains positive in the immediate future.
- RSI: The RSI remains neutral, neither signaling overbought nor oversold conditions, allowing room for further movement in either direction.
- MACD: While the MACD lines have crossed bearishly, signaling a short-term pullback, the histogram is showing signs of a bullish reversal, indicating potential upward momentum ahead.
MicroStrategy is likely to find support at the Fib level of $336. If this level fails to hold, the stock may test its next major support at the golden ratio level of $190, where it could find a stronger base for a rebound.

Sidebar rates
Related Posts
