WTI Crude Oil Holds Above $69: Key Risks and Technical Levels to Watch

WTI crude held above $69 on Wednesday as geopolitical risk premiums rose due to the Russia-Ukraine war.

Ukraine’s reported missile strike on a Russian border region using Western supplied weapons added to the tension and President Putin’s expansion of Russia’s nuclear doctrine added to the uncertainty.

Meanwhile Middle East tensions eased. The IAEA said Iran had agreed to pause near-weapons grade uranium enrichment and reports said Hezbollah had accepted a US proposal for a ceasefire with Israel so the outlook for global oil supply looks more stable.

Production: Equinor has resumed partial production at Johan Sverdrup, Western Europe’s largest oilfield. But the American Petroleum Institute (API) reported a 4.8 million barrel increase in US crude oil inventories last week, much higher than the 0.8 million barrel expected which could weigh on prices in the short term.

Technical Analysis: Key Resistance Levels Limit Gains

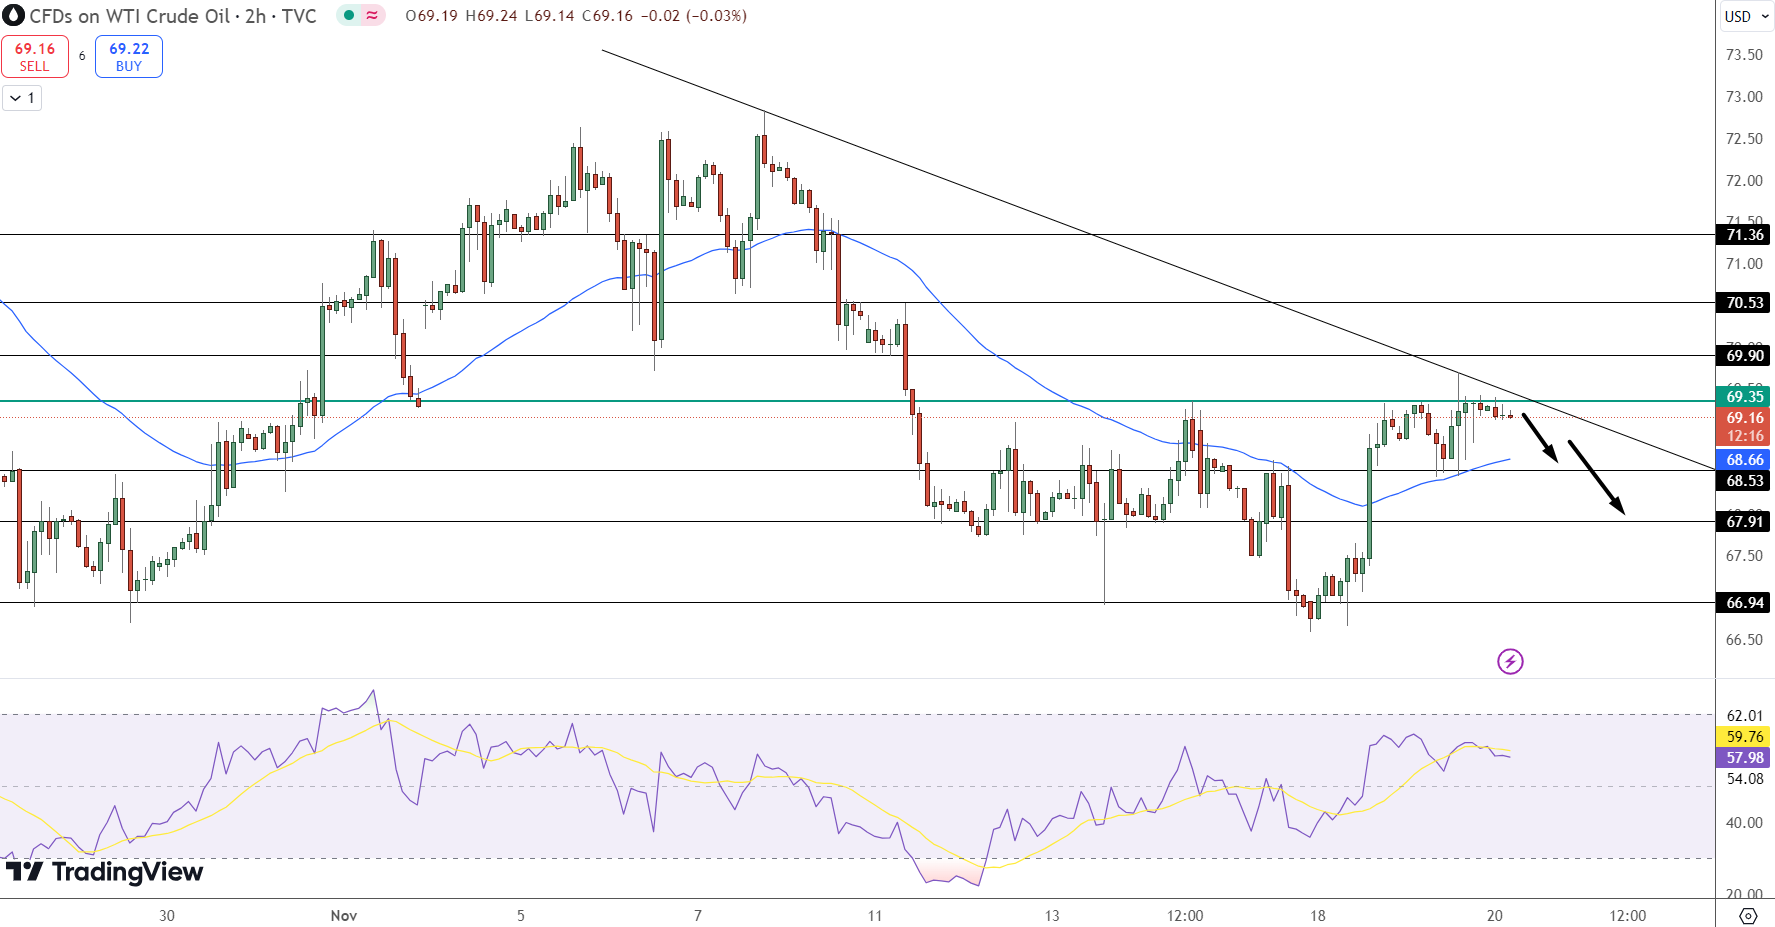
WTI crude is at $69.17 and is being pulled down by a strong trendline that has been the bearish trend. Immediate resistance is at $69.35 which is the trendline and stronger resistance is at $69.90 which is the 50 day EMA. A break above these levels could take it to $70.53.

Support is at $68.66 with additional support at $67.91 and $66.94. The RSI is 59.78 which is neutral but with a bearish bias so limited upside unless bullish momentum picks up.

Inventories and Geopolitical Risks Shape Market Sentiment

Crude oil inventories rose 4.8 million barrels last week according to API. This and rising geopolitical tensions make the market more complicated:

WTI Crude Oil Price Chart - Source: Tradingview
  • Geopolitical Risks: Russia-Ukraine war and nuclear concerns.

  • Middle East Tensions easing: Ceasefire talks and Iran’s uranium enrichment agreement.

  • Inventory Data: Higher US crude inventories could weigh on prices.

Conclusion:

WTI crude is under pressure, the trendline and resistance at $69.35 is capping gains. A break above $69.90 could be bullish and a drop below $68.66 could lead to a deeper correction to $66.94. Geopolitics and inventory data will be the key to the next move.

Check out our free forex signals
Follow the top economic events on FX Leaders economic calendar
Trade better, discover more Forex Trading Strategies
ABOUT THE AUTHOR See More
Avatar
Arslan Butt
Index & Commodity Analyst
Arslan Butt serves as the Lead Commodities and Indices Analyst, bringing a wealth of expertise to the field. With an MBA in Behavioral Finance and active progress towards a Ph.D., Arslan possesses a deep understanding of market dynamics. His professional journey includes a significant role as a senior analyst at a leading brokerage firm, complementing his extensive experience as a market analyst and day trader. Adept in educating others, Arslan has a commendable track record as an instructor and public speaker. His incisive analyses, particularly within the realms of cryptocurrency and forex markets, are showcased across esteemed financial publications such as ForexCrunch, InsideBitcoins, and EconomyWatch, solidifying his reputation in the financial community.
Related Articles
Comments
0 0 votes
Article Rating
Subscribe
Notify of
guest
0 Comments
Oldest
Newest Most Voted
Inline Feedbacks
View all comments