Gold Price Forecast: Prices Climb Over $2,650; Inflation Data and Fed Rate Cuts
Gold continued its upward momentum, closing the week around the 2,657 level and reaching an intra-day high of 2,661.

This bullish trend can be primarily attributed to a weakening US dollar, which lost ground following the release of inflation data and the Consumer Price Index (CPI) report on Friday.
However, the combination of a slightly higher CPI and disappointing US employment figures may prompt the Federal Reserve to implement additional rate cuts, further exerting pressure on the dollar and boosting gold prices.
Moreover, escalating geopolitical tensions in the Middle East, coupled with uncertainty surrounding the upcoming US elections, have also contributed to the sustained demand for gold, keeping its prices higher.
Gold rate today: Yellow metal remains elevated as easing US inflation fuels US Fed rate cut buzz. pic.twitter.com/DLPKnacehJ
— AKP Media (@AkpMedia_) October 12, 2024
Gold Prices Rise Amid Inflation Data and Rate Cut Expectations
On the US front, the broad-based US dollar lost some of its traction and edged lower amid recent inflation data.
However, the US Bureau of Labor Statistics (BLS) reported that the Producer Price Index (PPI) for September rose by 1.8% year-on-year, slightly above the expected 1.6%, but lower than August’s 1.9%.
Core PPI increased by 2.8%, surpassing forecasts, and inflation expectations among consumers rose from 2.7% to 2.9%.
Meanwhile, the University of Michigan’s Consumer Sentiment Index dropped from 70.1 to 68.9, indicating growing concerns among Americans about rising living costs.
Gold prices edged higher as traders reacted to the inflation figures, which suggest that the Federal Reserve might consider additional rate cuts.
Analysts note that the PPI numbers are favorable for gold and imply that the Fed remains on track for potential interest rate cuts later this year.
The recent inflation data, particularly the rise in the Producer Price Index (PPI), has boosted gold prices as traders anticipate potential interest rate cuts from the Federal Reserve.
This positive outlook for gold reflects increased demand amid rising consumer inflation concerns.
Global Commodities
The global commodity futures market closed the week mixed. Gold rose by 0.21%, following US inflation data that reinforced the expectation of a lower Fed rate cut and the demand for safe-haven assets due to the ongoing geopolitical tensions in the Middle East.…
— Proshare (@proshare) October 12, 2024
Daily Technical Outlook: Gold Spot (XAU/USD) – October 12, 2024
Gold is currently trading at $2,657, with prices testing a key downward trendline near $2,650, which has been acting as a strong resistance.
A decisive break above this level could trigger further bullish momentum, with the next resistance targets at $2,670 and $2,685.
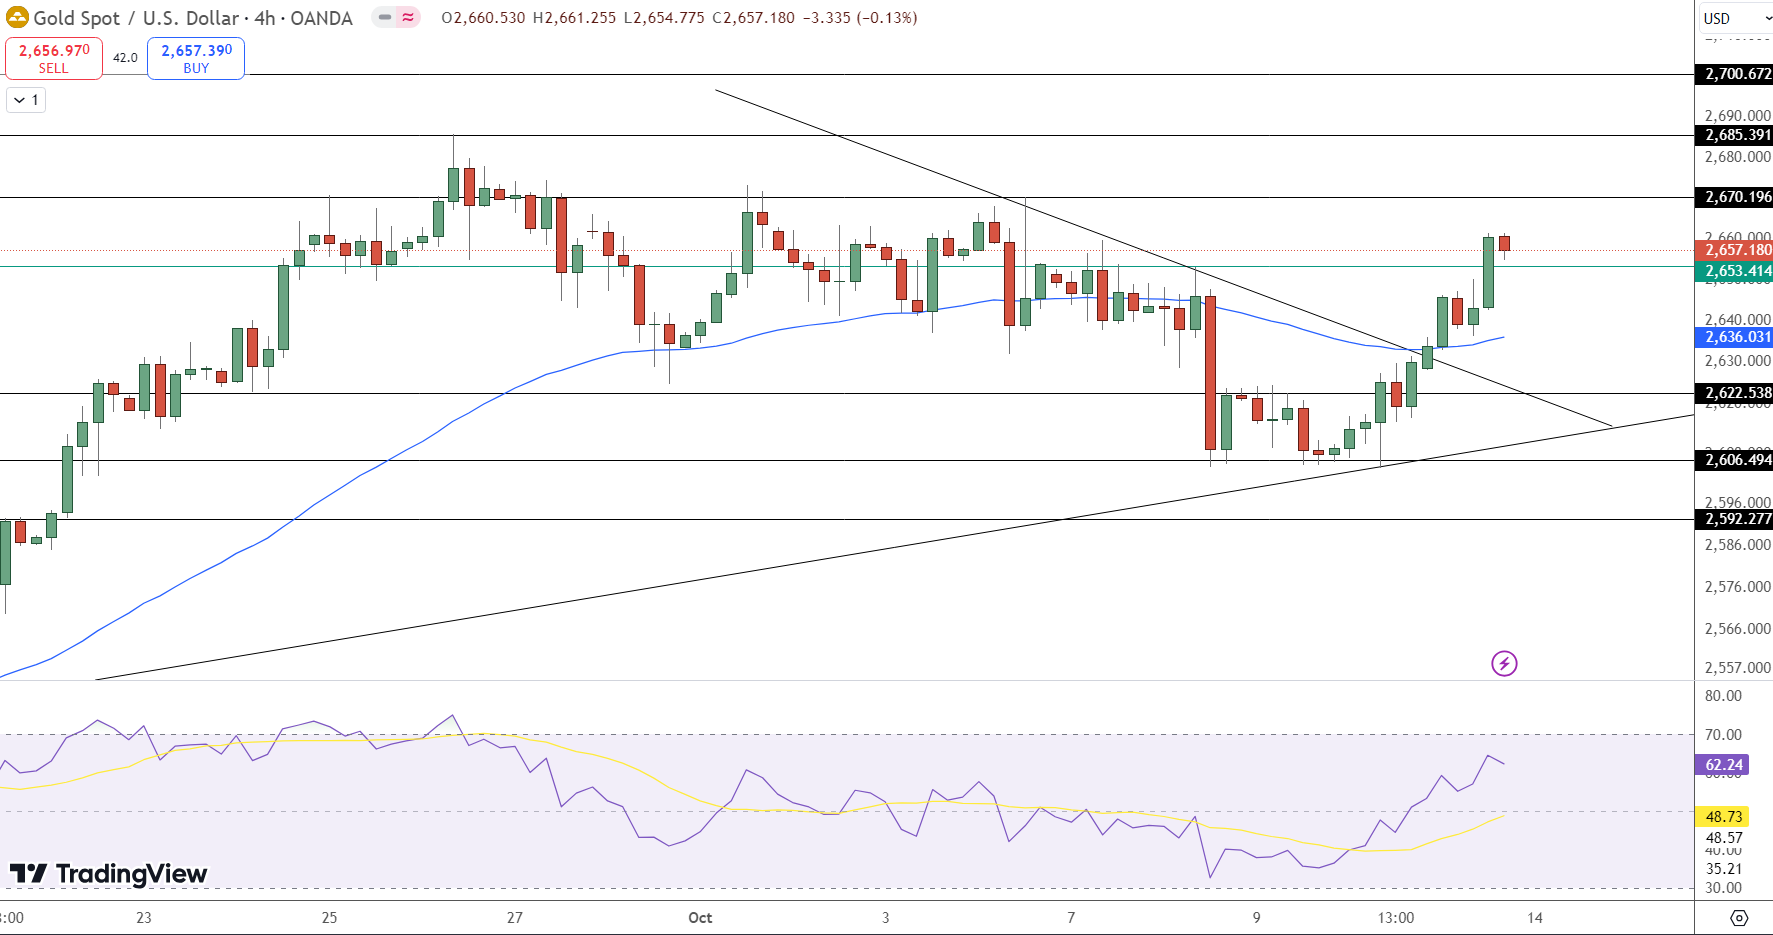
However, if gold fails to break above $2,650, immediate support lies at $2,653, followed by $2,636 and $2,622. The 50-day EMA at $2,636 provides crucial support, reinforcing the buying trend above this level.
The RSI is at 62, indicating mild overbought conditions but still room for more upside potential. A successful break above $2,653 could lead to an upward push, with traders eyeing the next resistance levels.