GBPUSD Faces the 200 Weekly SMA at 1.30 After the UK GDP Returns to Growth in August
GBPUSD made some decent gains in August and September, gaining nearly 8 cents, but it seems like the trend might be shifting from bullish to bearish. However, sellers still have some obstacles to take out for the bearish reversal to be official, such as the 200 SMA on the weekly chart.

The GBP/USD experienced a sharp reversal last week, dropping by 4 cents as sellers maintained pressure. Yesterday, renewed USD buying drove the pair even lower, pushing it close to the 1.30 level and breaching the 50-day SMA at 1.31—a signal of further bearish momentum.
GBP/USD Chart Weekly – The 200 SMA Holding for Now

The next major support is the 200-week SMA (purple), which has so far held steady. Although the U.S. CPI report initially pulled the pair lower, reactions were mixed. Following the release, GBP/USD dipped by about 30 pips before bouncing back as U.S. jobless claims unexpectedly rose to 250K, providing temporary support for the GBP. Today, the UK GDP report showed an anticipated 0.2% expansion for August, which could influence the pair as it encounters this new support level.
UK August GDP Report Released by ONS – 11 October 2024
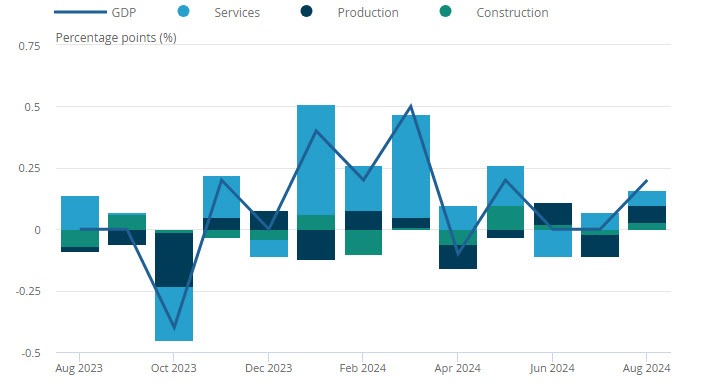
- Monthly GDP Growth (August):
- Actual: +0.2%
- Expected: +0.2%
- Prior Month: 0.0% (flat growth in July)
- Year-over-Year GDP Growth:
- Actual: +1.0%
- Expected: +1.4%
- Prior: Revised from +1.2% to +0.9%
- Sector Breakdown:
- Services Output:
- Actual: +0.1% m/m
- Expected: +0.2% m/m
- Slightly below expectations, indicating modest growth in the services sector.
- Industrial Production:
- Actual: +0.5% m/m
- Expected: +0.2% m/m
- Exceeded forecasts, driven by increased output in various industrial sectors.
- Manufacturing Output:
- Actual: +1.1% m/m
- Expected: +0.2% m/m
- Significant outperformance, suggesting a strong recovery in manufacturing activities.
- Construction Output:
- Actual: +0.4% m/m
- Expected: +0.4% m/m
- In line with expectations, reflecting steady performance in the construction sector.
- Services Output:
Overall, while the UK’s GDP growth was moderate, the industrial and manufacturing sectors showed stronger-than-expected growth, offering some optimism amid mixed performance in services. The UK GDP is anticipated to show some growth in August after remaining flat in both June and July. While each major sector saw only modest increases, this still indicates that the UK economy is maintaining some stability. Following a relatively steady performance in the first half of the year, these figures suggest that the economy continues to hold its ground to a certain extent.
GBP/USD Live Chart