Forex Signals Brief October 8: Risk Sentiment to Drive Markets Today
Yesterday the economic calendar was light, with China continuing to be on holiday. In the European session, Eurozone retail sales were the main event, with data coming in slightly above expectations. However, the market reaction was muted, as the release did not significantly impact trading sentiment.

The most notable drivers in the market were Treasury yields and crude oil prices. Treasury yields are climbing as the market has shifted to a more hawkish stance, dismissing aggressive rate-cutting expectations and moving beyond the Fed’s current projections. Meanwhile, oil prices are being supported by escalating Middle East tensions and an optimistic economic outlook. This combination of factors has bolstered crude oil, keeping prices elevated amid the uncertain geopolitical climate.
Today’s Market Expectations
Today started with the Earnings and Spending report from Japan. In September, Japan’s labor and spending data revealed mixed trends. Labor cash earnings grew by 3.0% year-over-year in August, slightly below the expected 3.1%, and down from the previous month’s 3.6% increase. However, inflation-adjusted real wages declined by 0.6% year-on-year, marking a reversal after two months of gains, mainly due to lower bonus payments. On the positive side, overtime pay saw a 2.6% increase year-on-year, indicating steady growth in supplementary earnings.
Household spending showed signs of recovery, with a 2.0% rise on a monthly basis, surpassing the expected 0.5% and bouncing back from a -1.7% decline in the prior month. On an annual basis, spending was down by 1.9%, though it was better than the anticipated -2.6% decline and an improvement over the slight gain of 0.1% seen previously. This suggests some resilience in household spending despite underlying wage pressures.
We also had the RBA meeting minutes from the last meeting. At the last meeting, the Reserve Bank of Australia (RBA) softened its hawkish stance, with Governor Bullock clarifying that rates would remain on hold for the moment. Notably, the board did not explicitly consider a rate hike this time, a shift from August when an increase was still on the table. Markets are likely to scrutinize the meeting minutes for further insights into this decision. In summary, the RBA kept rates steady, aligning with market expectations, yet maintained its hawkish tone by affirming its commitment to bringing inflation back to target levels. While the board is holding off on immediate hikes, it emphasized that all options remain open.
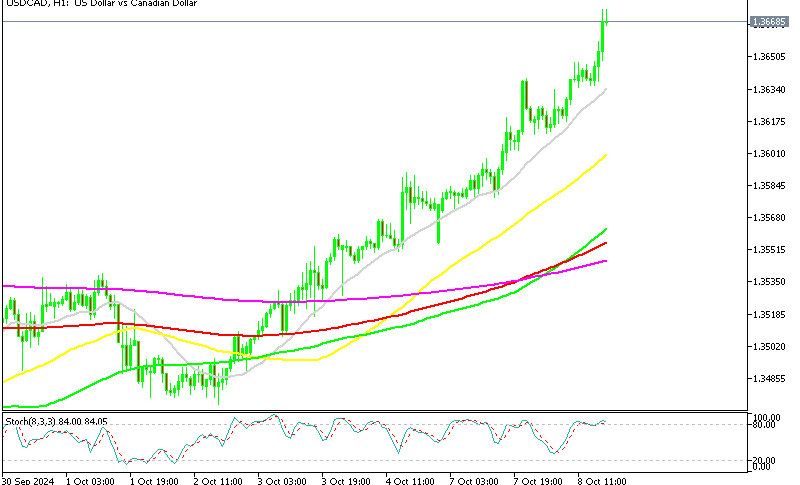
Yesterday markets were quiet, with the USD retreating slightly after Friday’s gains, but resuming the upside momentum in the US session. There weren’t any surprises and the volatility was low, so we only had four closed trading signals. We ended up with three winning forex signals and a losing one.
Gold Remains Supported by the 100 SMA
Gold prices have been climbing steadily in 2024, driven by increased demand for safe-haven assets amid political, geopolitical, and economic turmoil. Gold peaked at $2,685 last Thursday before dropping to $2,624 by Monday, though it found strong support at the 50 SMA on the H4 chart. Rising tensions in the Middle East, including Israeli forces entering Lebanon and an Iranian missile strike, briefly lifted XAU/USD. However, it did not surpass previous highs or the lows so the range continues.
XAU/USD – H1 chart
USD/JPY Hesitates at Resistance
Over the summer, USD/JPY fell by over 22 cents as the carry trade unwound. However, a robust 7-cent rally last week pushed the pair closer to the 50% Fibonacci retracement level of the decline from 162.00 to 139.50. The next target for this retracement is 151.80, but the pair will encounter resistance at the 100-day SMA, around 149.40, which marks the high from mid-August’s retracement.
USD/JPY – Daily Chart
Cryptocurrency Update
Bitcoin Falls to $60,000 on Risk Aversion
Bitcoin has been trending downward since April, when it reached nearly $70,000. By August, it had fallen below $50,000, prompted by a global sell-off amid economic concerns in the US. This confirmed a bearish pattern with declining highs and lows. Despite attempts by buyers to stabilize the price, Bitcoin has struggled to break through resistance around $65,000, with the 200-day SMA reinforcing the bearish trend. BTC dropped to $60,000, but bounced back over the weekend.
BTC/USD – Daily chart
Ethereum Returns Below $2,500
Ethereum has also seen a downturn since March, dropping from $3,830 to below $3,000 by June. Consistent selling pressure pushed ETH/USD down to $2,200 before a slight recovery above the 50-day SMA. Currently, the 100-week SMA offers solid support around $2,500, while the 50-week SMA acts as resistance.
ETH/USD – Weekly chart


