WTI Crude Oil Rallies 2% to $71 Amid Iran-Israel Tensions – Key Levels to Watch
Arslan Butt•Wednesday, October 2, 2024•2 min read
WTI crude oil futures surged past $71 per barrel on Wednesday, continuing a 2% gain from the previous session.
The upward momentum is largely driven by heightened geopolitical risks in the Middle East, following Iran’s missile launch targeting Israel. As Iran is a major OPEC member, its direct involvement in the conflict raises concerns over potential disruptions to oil supply chains.
Israel reported that Iran launched over 180 ballistic missiles on Tuesday in retaliation for Israeli military actions against Tehran’s Hezbollah allies in Lebanon. In response, the Israeli military announced it would intensify strikes across the Middle East, threatening to escalate the conflict further.
WTI crude oil futures rose toward $71 per barrel extending an over 2% gain from the previous session, driven by fears of a broader war in the Middle East after Iran’s missile launch targeting Israel. Involvement of Iran, increases the likelihood of disruptions to the oil supply.
This geopolitical unrest has traders eyeing the potential impact on oil supply from the region, further supporting prices. Meanwhile, concerns of reduced supply were compounded by American Petroleum Institute (API) data showing a 1.5 million barrel decline in U.S. crude inventories last week, marking a second consecutive weekly draw. However, the figure fell short of the anticipated 2.1 million-barrel decline, suggesting some uncertainty in the market’s supply outlook.
Technical Analysis: Strong Bullish Momentum
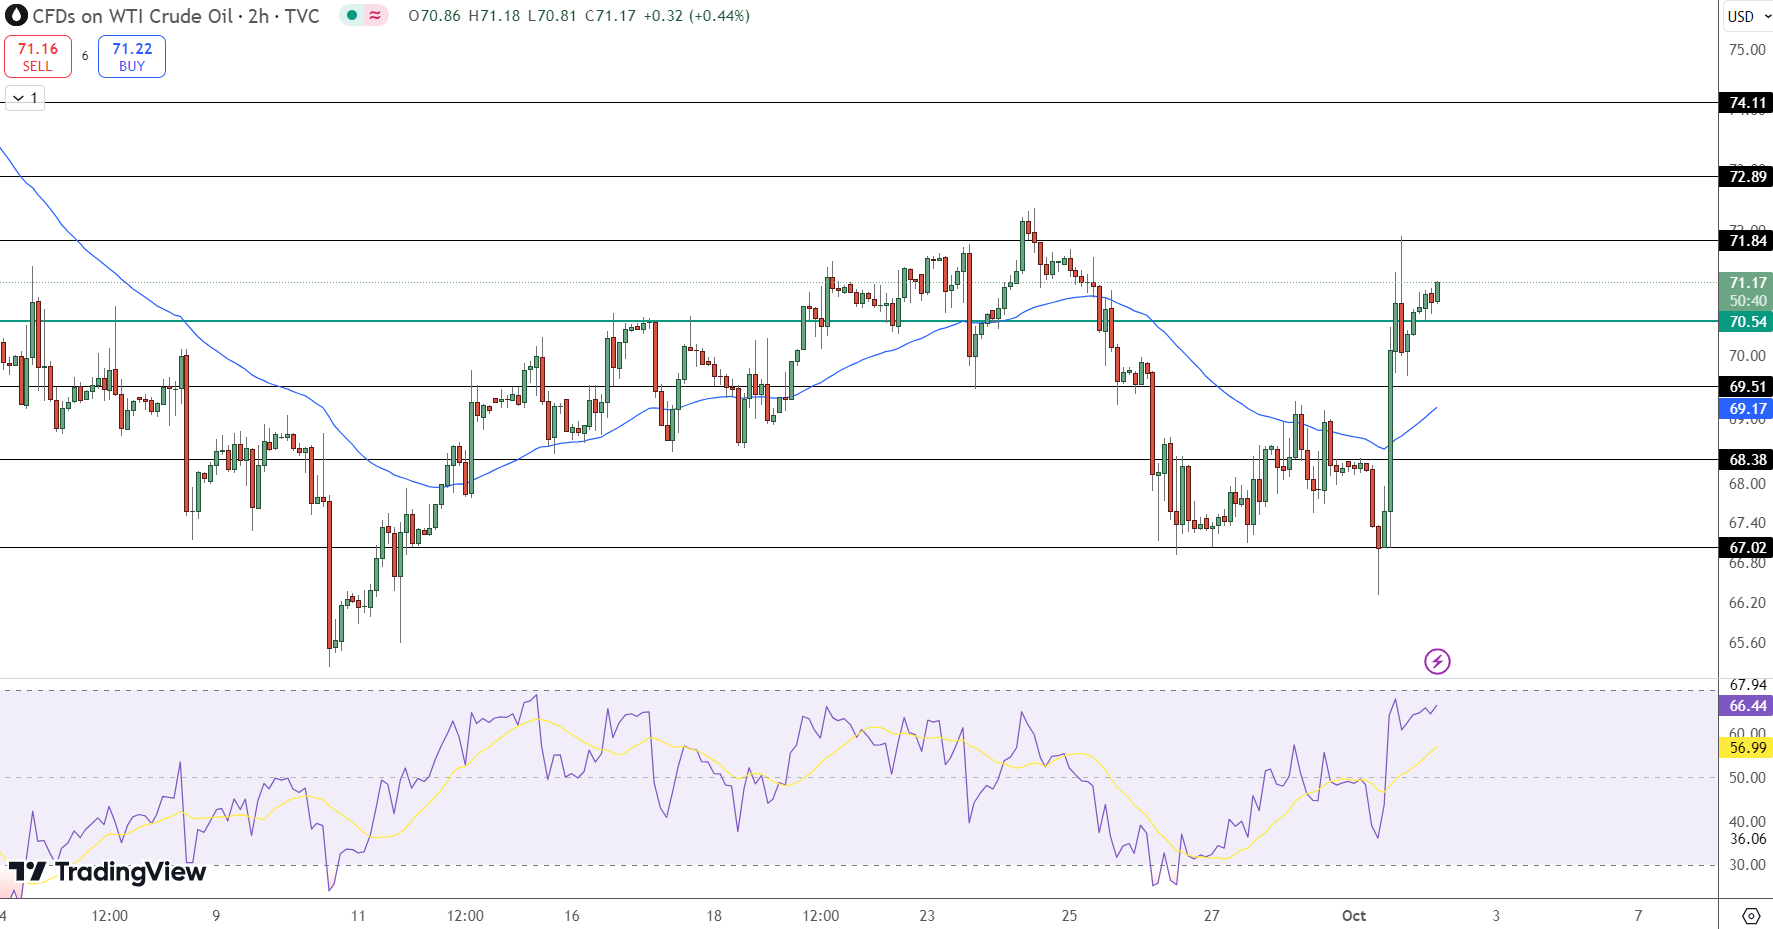
From a technical standpoint, WTI Crude Oil has established a bullish trend, breaking above the $70.54 pivot point and reaching an intraday high of $71.84. This movement is supported by the price crossing above the 50-day Exponential Moving Average (EMA) at $69.51, signaling a continuation of the upward trajectory.
Immediate resistance is noted at $71.84, and a break above this level could propel prices towards the next resistance zones at $72.89 and $74.11. On the downside, immediate support is located at $70.54, followed by $69.51 and $68.38. These levels will be critical for maintaining the current bullish sentiment, as a breach below them could trigger a pullback.
Crude Oil Prices Surge 5% After Iran Missile Strikes on Israel
Crude oil prices surged by 5% on Tuesday following Iran's missile strikes on Israel, sparking fears of potential conflict in the Middle East. WTI crude exceeded $71 per barrel, while Brent crude rose above $75 per… pic.twitter.com/WtKtGKineJ
The Relative Strength Index (RSI) currently stands at 66.44, indicating strong bullish momentum but nearing overbought territory. Traders should monitor this indicator closely as a drop below 60 could signal waning momentum and potential price consolidation or reversal.
Key Insights:
Immediate Resistance: $71.84 – A break above this level could pave the way for a test of $72.89.
Support Levels: $70.54 and $69.51 – Key areas to watch for potential retracement.
Bullish Momentum:RSI at 66.44 suggests continued upward pressure, but a pullback is possible if overbought conditions persist.
Conclusion:
WTI Crude Oil remains in a bullish phase as long as it trades above $70.54. Sustaining this level could see prices pushing towards $72.89, while a reversal below support levels might dampen the current rally.
Arslan Butt serves as the Lead Commodities and Indices Analyst, bringing a wealth of expertise to the field. With an MBA in Behavioral Finance and active progress towards a Ph.D., Arslan possesses a deep understanding of market dynamics.His professional journey includes a significant role as a senior analyst at a leading brokerage firm, complementing his extensive experience as a market analyst and day trader. Adept in educating others, Arslan has a commendable track record as an instructor and public speaker.His incisive analyses, particularly within the realms of cryptocurrency and forex markets, are showcased across esteemed financial publications such as ForexCrunch, InsideBitcoins, and EconomyWatch, solidifying his reputation in the financial community.