Stock Markets Drop Amid Middle East Tensions—S&P 500 and NASDAQ Price Analysis
Major stock indices are declining amid poor economic data and rising Middle East tensions. Iran’s missile strikes pushed WTI crude up 2.23% to $71.39.
Fed Chair Powell’s comments on rate cuts and a potential dockworkers’ strike added to the uncertainty, keeping investors on edge ahead of key employment data.
After the Israel Defense Forces said Iran was launching missiles at the country, the price of West Texas Intermediate crude oil surged 2.23% reaching 71.39.
Rising worry among traders was highlighted by the CBOE Volatility Index (VIX), sometimes referred to as Wall Street’s fear barometer, topping 20 at its peak of the day.
Iran threatened to escalate the conflict in the Middle East by launching a missile bombardment at Israel.
The Israeli military said that regular infantry and armored units were joining ground operations in southern Lebanon, stepping up pressure on Hezbollah, as Israel prepared to retaliate against a barrage of Iranian missile strikes a day earlier https://t.co/GsMIUn0YHe
— Reuters (@Reuters) October 2, 2024
Some of the largest and most widely held equities in the market have been leading the losses.
Nvidia dropped 3.66%, Apple declined 2.91%, Tesla fell 1.38%, and Microsoft slipped 2.23%. Meta Platforms and Alphabet were the only two of the “Magnificent 7” that ended slightly higher, gaining 0.7% and 0.74%, respectively.
The top performers in the S&P 500 were shares of Paychex (PAYX) shares, gaining 4.9% as the payroll services provider reported higher-than-expected sales and profits in its fiscal first quarter.
Nvidia Stock Slips Again. Why Israel-Iran Tensions Weighed On the Chip Maker’s Shares. https://t.co/HP3Hi2Bl0u
— Barron's (@barronsonline) October 2, 2024
Regulatory documents state that Michael Dell, founder and CEO of Dell Technologies (DELL), a recent addition to the S&P 500, sold a $1.2 billion interest in the computer hardware and services provider.
Significant selling by business executives can make investors less hopeful about a stock’s predicted course, and Tuesday’s Dell shares fell 4.47%.
As investors look out for more stable markets, such as utilities, the technology sector has nonetheless taken the biggest blow.
Comments by Fed Chair Jerome Powell also help explain why major Wall Street indexes fell at the open.
Fed Chair Powell seems to challenge the likelihood of another 50 bps rate cut in November. The new statistics showed that manufacturing activity in the United States is still falling.
Important employment data that had been leaked for the past several weeks finally surfaced on Tuesday, with the BLS reporting an increase in US JOLTS job vacancies to 8.04 million in August.
HIGH IMPACT NEWS AHEAD⚠️
– US JOLTS JOB OPENINGS
– US ISM MANUFACTURING PMIBe careful in the market today, protect your capital, don't be greedy.
If you are afraid, better watch and learn how the market moves. pic.twitter.com/n0ejQcfkJZ
— Ananta (@Dollaoverlord) October 1, 2024
As the US confronted growing recessionary concerns ahead of the September rate decrease, labor statistics became increasingly important for markets.
The strike of dockworkers at port facilities on the East and Gulf coastlines added another element to key U.S. equity indices’ fall. Members of the International Longshoremen’s Association (ILA) could disrupt supply chains and have a domino effect on the whole economy, including perhaps a rise in inflation, through their labor action.
US East Coast and Gulf Coast dockworkers began a strike across dozens of ports from Maine to Texas in a disruption analysts warned will cost the economy billions of dollars a day, threaten jobs and potentially stoke inflation https://t.co/DVFTt6e8jf pic.twitter.com/4MoZrWf49w
— Reuters Legal (@ReutersLegal) October 2, 2024
Beyond Middle East tensions, the Fed’s interest rate decreases, and port strikes, numerous possible triggers can keep investors on edge, including the approaching U.S. election in November and a crucial job report this week that will influence Fed policy direction.
NASDAQ 100 Index (NDX) – Technical Analysis
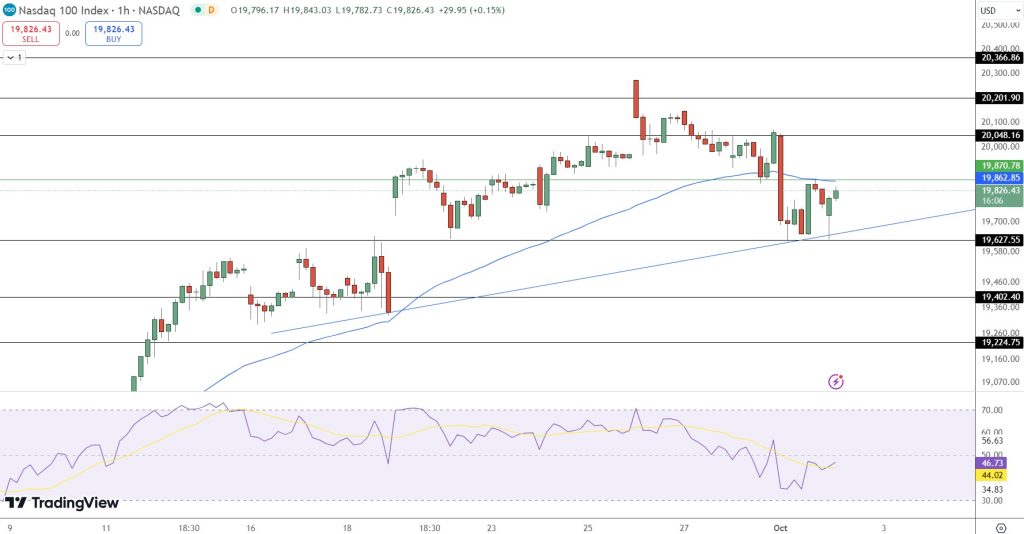
The NASDAQ 100 is showing signs of cautious consolidation as it hovers near the $19,826 mark, following a rebound from the immediate support level at $19,627.
The index remains slightly below its 50-day Exponential Moving Average (EMA), reflecting subdued sentiment among traders. A break above the key pivot point at $19,862 could trigger a bullish momentum, targeting the immediate resistance at $19,870, with further advances likely towards $20,048 and $20,201.
On the downside, a failure to sustain above $19,627 could lead to a retest of the next support at $19,402, with $19,224 acting as the critical floor. The Relative Strength Index (RSI) currently stands at 44.02, indicating potential consolidation in the near term.
Traders should watch for a break above the 50 EMA to confirm a bullish reversal, while a decline below $19,627 would signal increased bearish pressure.
S&P 500 Index (SPX) – Technical Analysis
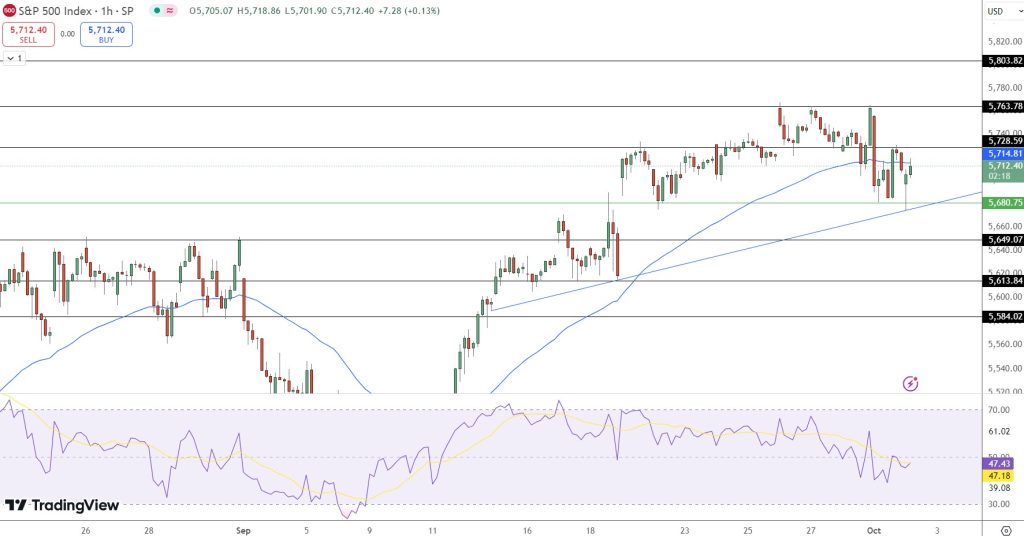
The S&P 500 is attempting to regain upward momentum, trading at $5,712 after a brief pullback to its immediate support level of $5,680. The index remains above its 50-day Exponential Moving Average, reflecting an underlying bullish bias despite recent corrections.
The RSI stands at 47.18, suggesting that the index is in a neutral position and could potentially rebound if the $5,680 support holds. Immediate resistance is seen at $5,728, with additional targets at $5,763 and $5,803 if upward momentum strengthens.
However, if the S&P 500 breaks below $5,680, it could slide towards the next support levels at $5,649 and $5,613.
Traders should monitor these levels closely, as a decisive move above $5,728 would reaffirm the bullish outlook, while a dip below $5,680 could signal a deeper correction.