


Forex Signals Brief September 23: RBA, SNB and US PCE Inflation
This week we have two more central bank meetings, as well as the US PCE inflation report, however the attention last week centered on the FOMC decision. During the first half of the week, the forex market was mixed as odds between a 25 bps cut and a 50 bps cut were balanced, however, we saw a temporary improvement for the USD, after the positive US retail sales numbers for August, which showed that the US consumer is not faltering.

But, after the FOMC meeting, which produced a 50 basis points rate reduction, the USD turned lower after some wobbling and everything else benefited from the improved sentiment. EUR/USD remained above 1.11 throughout the week, despite the weakening Eurozone economic sentiment.
GOLD proceeded to make new record highs, closing the week above $2,600 as economic and political uncertainties remain elevated throughout the globe, Main US stock indices such as the S&P 500 also remained bullish all week and made new record highs after a small dip following the FED meeting.
This week’s Market Expectations
This week we have two more major central bank meetings, with the Reserve Bank of Australia (RBA) meeting tomorrow morning. They’re not expected to cut interest rates, but might tilt further toward dovish, which would send the SUD lower nonetheless. Later in the week we also have the Swiss National bank which is expected to deliver yet another 25 bps rate cut, while on Friday we have the FED’s favourite inflation report, the Core PCE data.
This Week’s Upcoming Events
Last week was difficult for traders, with markets changing direction many times as the odds of the FED rate cut expectations kept changing, while after the 50 bps FOMC rate cut we saw further volatility. We also had a difficult time in the first half of the week, but improved the performance as the dust settled after the FED meeting and markets set a bullish direction, with the USD retreating. We opened 43 trading signals last week, ending the week with 30 winning forex signals and 13 losing ones.
Gold Moves above $2,600
Gold has maintained its upward momentum, briefly touching $2,600 on Thursday after the Fed announced a 50 basis point rate cut. Although there was a $50 dip following the news, strong buying pressure resurfaced overnight, pushing prices close to a new high of $2,625. The demand for safe-haven assets remains robust, and gold is poised for another potential high.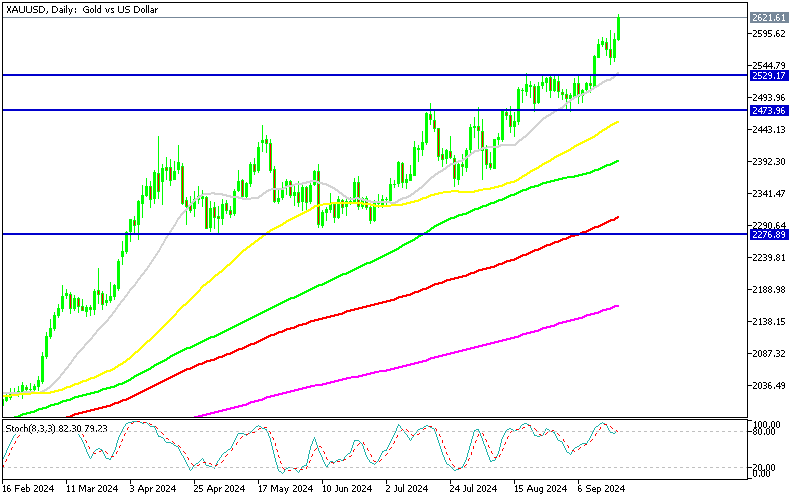
XAU/USD – Daily chart
AUD/USD Fails at the 100 Weekly SMA
Last week, AUD/USD reached a new 2024 peak as risk sentiment improved in the wake of the FOMC’s rate cut. We capitalized on this by going long and issuing a buy signal on AUD/USD. The pair rose by more than a cent over the week, driven by the Fed’s dovish stance, which weakened the US dollar and contributed to the AUD/USD rally. Most of the gains came from US dollar softness, and by Thursday, AUD/USD hit a high of 0.68384. However, it faced difficulty maintaining momentum above the key resistance at 0.6823, resulting in a brief pullback, though it ended the week above 0.68.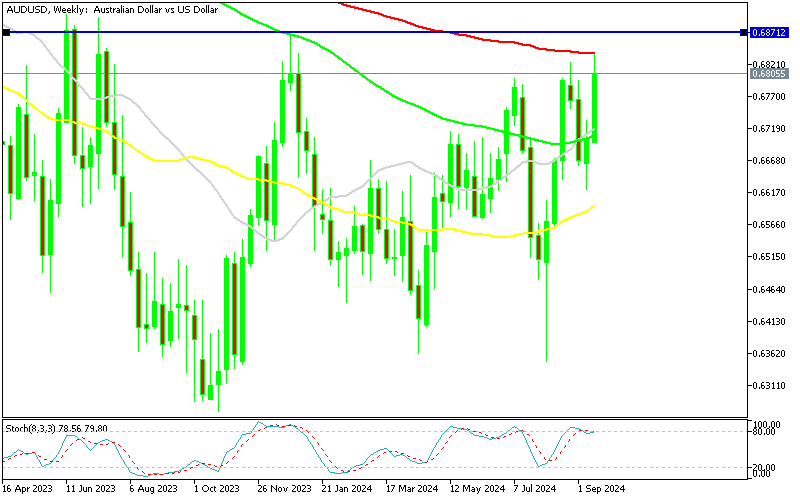
AUD/USD – Weekly Chart
Cryptocurrency Update
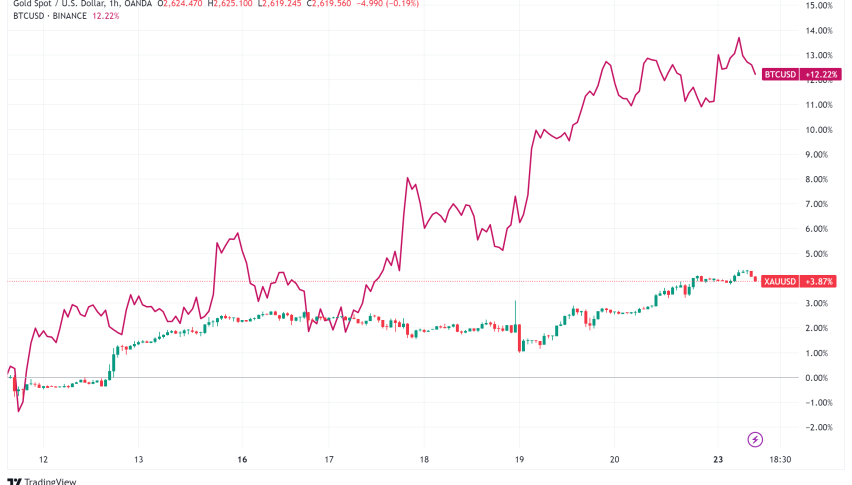
Bitcoin Rejected by the 200 SMA

BTC/USD – Daily chart
Ethereum Bounces Off the 200 Weekly SMA
Similarly, Ethereum has been in a downtrend since March, falling from $3,830 to below $3,000 by June. Although there was a brief recovery above the 50-day moving average, heavy selling pressure soon followed, driving the price below $2,200. Despite this, Ethereum found strong support at that level and recently rebounded off the 100-week SMA, forming a bullish candlestick. This suggests increased buying activity and a potential reversal of Ethereum’s bearish trend.
ETH/USD – Weekly chart


🏆 7 Best Forex Brokers
| Broker | Website | |
|---|---|---|
| 🥇 |  | Visit Broker |
| 🥈 | Visit Broker | |
| 🥉 |  | Visit Broker |
| 4 |  | Visit Broker |
| 5 |  | Visit Broker |
| 6 |  | Visit Broker |
| 7 |  | Visit Broker |