WTI Crude Oil Nears Key Support Levels as Downtrend Persists, Eyeing $67.55
Arslan Butt•Tuesday, September 17, 2024•2 min read
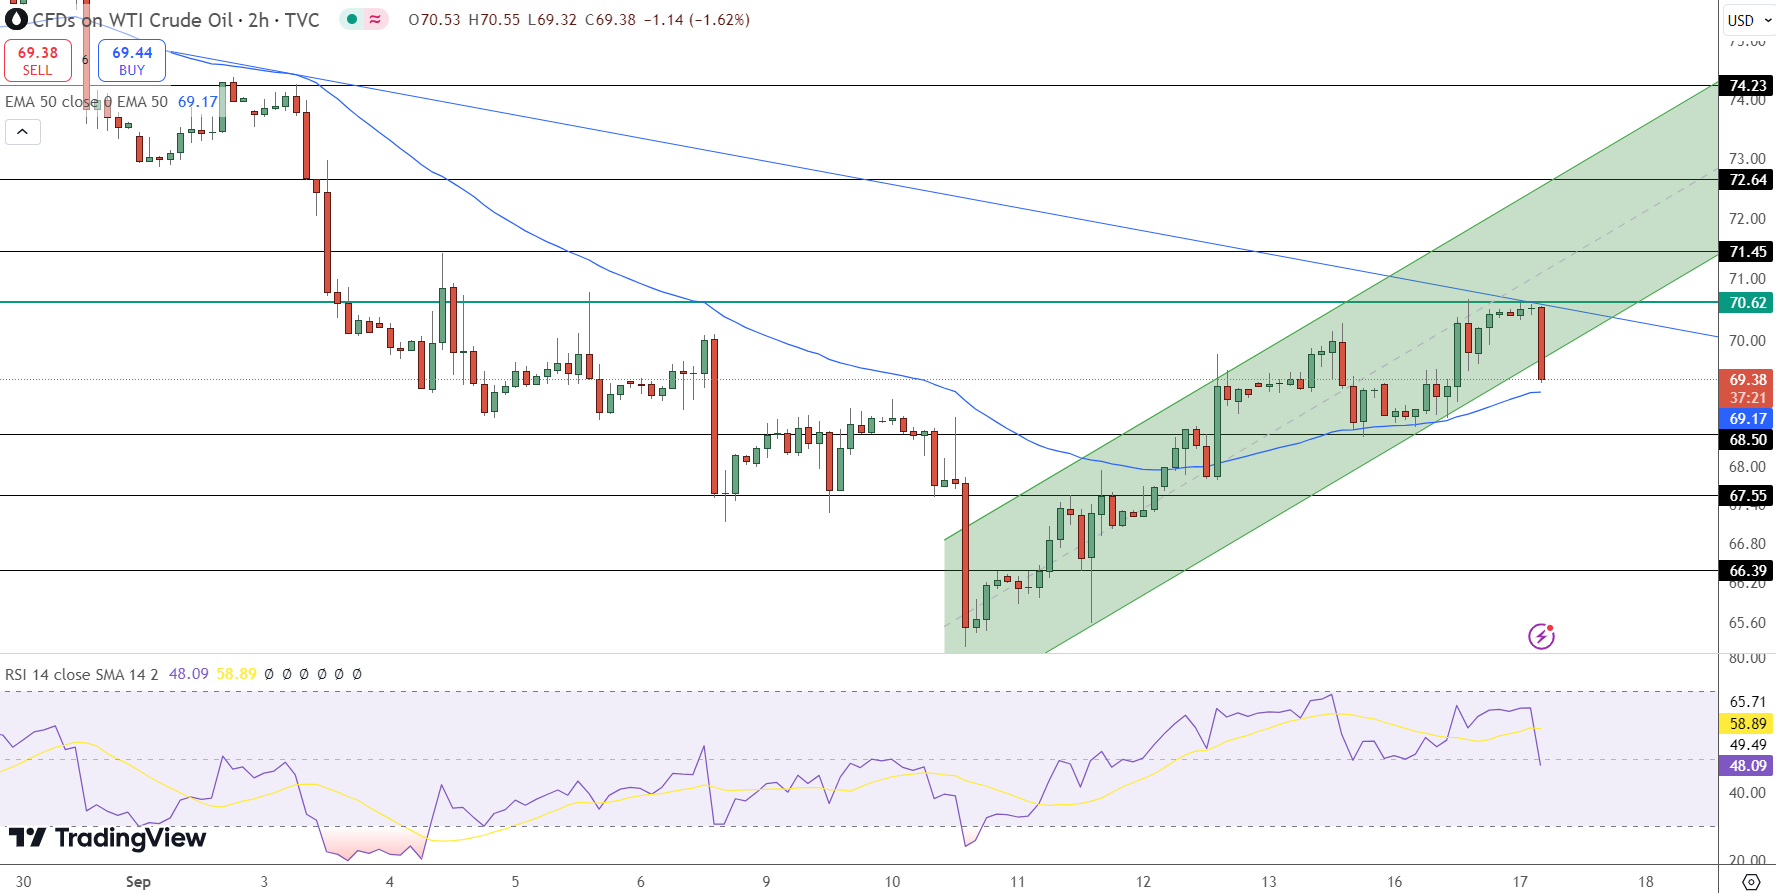
WTI Crude Oil remains under pressure, trading below the crucial pivot point of $70.62, suggesting a cautious downtrend.
After slipping beneath $70, the price found interim support at $68.50, with further downside risks toward $67.55 if bearish momentum persists. The 50-day Exponential Moving Average (EMA) at $69.17 is providing some weak support, but a sustained break above this level could signal a shift in market sentiment.
The Relative Strength Index (RSI) is sitting at 48, reflecting a neutral stance, with neither bulls nor bears in clear control. However, the recent downward pressure indicates that sellers may still dominate.
Technical Levels to Watch: Support and Resistance
For WTI Crude Oil to break out of its current downtrend, it needs to overcome immediate resistance at $71.45. A move above this could open the door for further upside, with the next resistance level at $72.64. Conversely, a break below $68.50 could trigger further declines, with the next key support level at $67.55. Should prices continue falling, the market could test even lower levels, possibly reaching $66.39.
Impact of U.S. Output Concerns and Market Sentiment
The outlook for WTI Crude Oil is also being shaped by external factors. Supply disruptions caused by Hurricane Francine in the U.S. Gulf of Mexico have taken over 12% of U.S. crude production offline, according to the U.S. Bureau of Safety and Environmental Enforcement (BSEE).
These disruptions, combined with expectations of a possible Federal Reserve interest rate cut, have injected some optimism into the market. Lower interest rates typically reduce borrowing costs, which could help boost oil demand by supporting broader economic growth.
However, lower-than-expected demand growth in China, the world’s largest oil importer, has tempered any significant price gains. Recent data revealed a decline in Chinese oil refinery output for the fifth consecutive month in August, signaling weaker demand in the region.
— WTI Trading Group- 🇺🇸 US Crude Oil Trader🛢️🌎 (@DB_WTI) September 17, 2024
Conclusion: Watch for Key Breakout or Breakdown Levels
WTI Crude Oil prices continue to face downward pressure, with immediate support at $68.50 and the potential for further declines if the market breaks below this level. Investors should keep an eye on upcoming Federal Reserve decisions and U.S. crude inventory data, as these factors could influence short-term price action.
Key Summary Insights:
Immediate support lies at $68.50, with further downside toward $67.55.
RSI at 48 suggests a neutral momentum shift, with bears slightly in control.
A break above $70.65 could trigger bullish sentiment, targeting $71.45.
Arslan Butt serves as the Lead Commodities and Indices Analyst, bringing a wealth of expertise to the field. With an MBA in Behavioral Finance and active progress towards a Ph.D., Arslan possesses a deep understanding of market dynamics.His professional journey includes a significant role as a senior analyst at a leading brokerage firm, complementing his extensive experience as a market analyst and day trader. Adept in educating others, Arslan has a commendable track record as an instructor and public speaker.His incisive analyses, particularly within the realms of cryptocurrency and forex markets, are showcased across esteemed financial publications such as ForexCrunch, InsideBitcoins, and EconomyWatch, solidifying his reputation in the financial community.