USDJPY Jumps 1 Cent on Better US Retail Sales
USD/JPY had been on a downward trajectory, falling below its August low and briefly dipping under the key 140 level yesterday. However, the pair has since recovered, gaining 1 cent today, following stronger-than-expected US retail sales data for August.

The probability of a 50 basis point rate cut by the Federal Reserve has risen since last week, prompting a renewed decline in the USD after the release of US CPI and PPI inflation data. The US inflation report was mixed. While headline inflation figures continue to trend towards the Fed’s 2% target, core CPI YoY remains elevated, which has supported safe-haven assets. Despite this, USD/JPY has regained some strength and is now approaching the 142 mark.
USD/JPY Chart H4 – MAs Continue to Act As Resistance

Earlier in August, USD/JPY dropped sharply by 20 cents to 141.69 before staging a minor recovery. The downward trend resumed shortly after, pushing the lows another 2 cents lower. Markets are closely following the upcoming Fed rate decision tomorrow, with current bullish price action possibly short-lived. The likelihood of a 50 basis point cut remains high, sitting at around 67%, which could lead to further USD weakness in the near term.
US August 2024 data on retail sales from the Census Bureau![US retail sales control group August]()
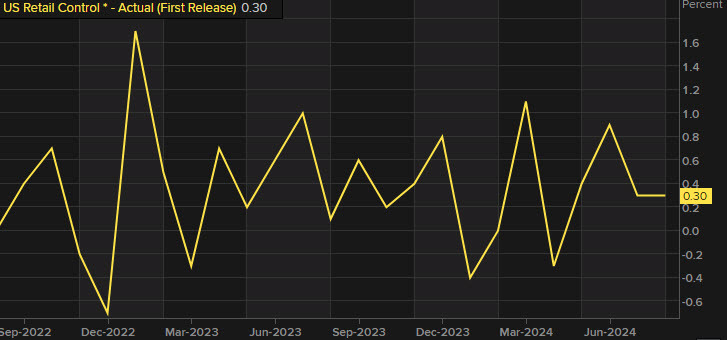
- Headline Retail Sales: +0.1% vs. -0.2% expected, showing modest growth.
- Previous headline: -0.2% (revised to -0.1%).
- Month-over-month (m/m) sales: +1.0% (revised to +1.1%).
- Retail Sales Control Group: +0.3%, matching expectations.
- Retail sales value: $710.8 billion vs. $709.7 billion prior.
- Year-over-Year (YoY): +2.1%, down from +2.7% prior.
- Excluding autos: +0.1% vs. +0.2% expected.
- Previous ex autos: +0.4%.
- Ex autos and gas: +0.2% vs. +0.4% prior.
Category Breakdown:
- Food services & drinking places: 0.0% vs. +0.2% prior.
- Nonstore retailers: +1.4% vs. -0.4% prior.
- Gasoline stations: -1.2% vs. +0.5% prior.
- Building materials: +0.1% vs. +0.8% prior.
- Clothing stores: -0.7% vs. +0.1% prior.
- Motor vehicle & parts dealers: -0.1% vs. +4.4% prior.
This report leans toward the positive side, showing resilience in certain sectors like nonstore retailers but highlights weakness in others, such as gasoline stations and clothing stores.
USD/JPY Live Chart