New Record High in Gold at $2,550, As US Employment Stabilizes
Gold has finally broken the resistance at the $2,531 August high and has placed a new record high at $2,551 after the US PPI and Unemployment Claims data. The lows have been getting higher, suggesting buying pressure, while the 20 SMA was acting as support on the daily chart, so the breakout that we highlighted yesterday wasn’t a major surprise for us.
Gold Chart Daily – Bullish Breakout Out of the Triangle

Since mid-August, gold prices have oscillated between $2,470 and $2,531, with the rising lows being interpreted as a positive signal for further gains. The frequent testing of resistance, more so than support, has also hinted at a potential bullish breakout. Today, with stronger buying momentum, the price finally broke through the upper resistance zone, which suggests that this previous resistance level may now turn into a support zone, indicating further upward potential for gold. The US core PPI inflation was sticky, similar to yesterday’s core CPI numbers, while unemployment claims remained steady, showing that the US jobs sector is not deteriorating.
US Unemployment Claims by the Department of Labor – 12 September 2024
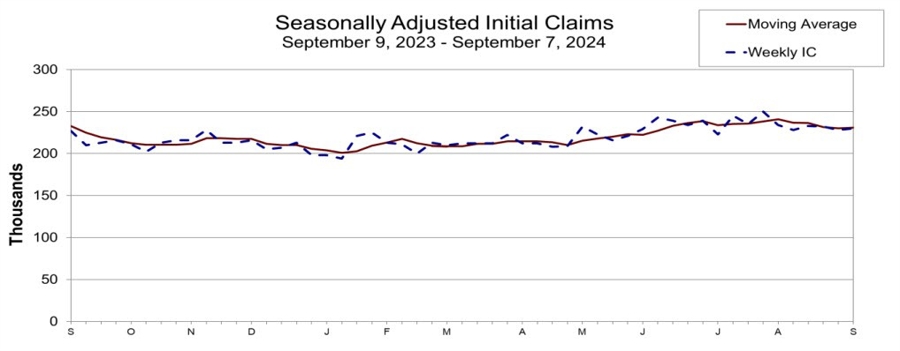
- Initial Jobless Claims: 230K, matching expectations. Prior figure revised from 227K to 228K.
- 4-week Moving Average: 231K, a slight increase from 230K in the previous report.
- Continuing Claims: 1.850M, as expected. The previous figure was revised from 1.838M to 1.845M.
- Key Insights:
- Initial jobless claims remain steady and are lower than the high of 250K reported last month.
- Continuing claims rose slightly, but the 4-week moving average continues to decline, indicating a positive trend in longer-term job stability (1.852M vs. 1.854M in the prior week).
- Regional Data:
- Largest Increases in initial claims for the week ending August 31:
- Massachusetts (+2,230)
- Wisconsin (+820)
- Ohio (+806)
- Pennsylvania (+724)
- Washington (+399)
- Largest Decreases:
- Texas (-1,396)
- New York (-1,185)
- North Dakota (-919)
- California (-833)
- Indiana (-796)
- Largest Increases in initial claims for the week ending August 31:
Despite minor fluctuations, the overall labor market remains relatively stable, with improvements seen in continuing claims.
US PPI Final Demand Report for August![PPI Final demand]()
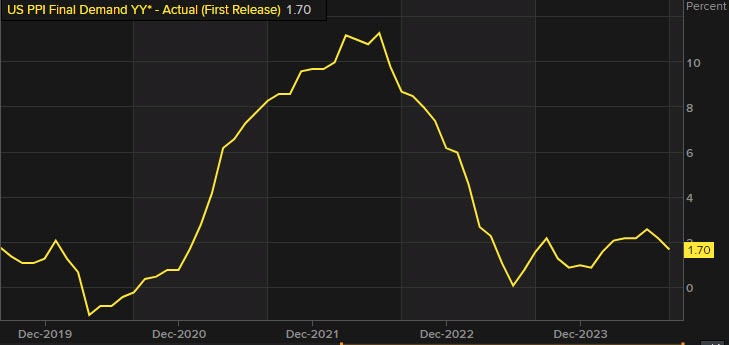
- PPI Final Demand YoY: Increased 1.7%, slightly below the 1.8% estimate; prior month was 2.2%, revised to 2.1%.
- PPI Final Demand MoM: Rose 0.2%, surpassing the 0.1% estimate; previous month was 0.1%, revised to 0.0%.
- PPI Excluding Food and Energy YoY: Increased 2.4%, matching the prior figure but slightly below the 2.5% estimate; previous month revised from 2.4% to 2.3%.
- PPI Excluding Food and Energy MoM: Rose 0.3%, exceeding the 0.2% estimate; previous figure was 0.0%, revised to -0.2%.
- PPI Food, Energy, and Trade YoY: Unchanged at 3.3%, but the prior figure was revised to 3.2%. MoM increase of 0.3% matched expectations.
Final Demand Services:
- Service Prices: Rose 0.4% in August after a 0.3% decline in July.
- Main Driver: 60% of the increase is attributed to a 0.3% rise in final demand services, excluding trade, transportation, and warehousing.
- Margins: Final demand trade services margins increased 0.6%.
- Transport & Warehousing: Services prices decreased by 0.1%.
Key Product Details:
- Guestroom Rentals: Prices surged 4.8%, contributing significantly to August’s PPI rise.
- Other increases:
- Machinery & vehicle wholesaling
- Automotive fuels and lubricants retailing
- Residential real estate loans
- Professional & commercial equipment wholesaling
- Furniture retailing
- Price Decreases:
- Airline passenger services dropped 0.8%.
- Declines in food & alcohol retailing and recreational facility use fees.
Final Demand Goods:
- Goods Prices: Unchanged in August, following a 0.6% rise in July.
- Core goods (excluding food & energy): Rose 0.2%.
- Food: Prices increased 0.1%.
- Energy: Dropped -0.9%.
Specific Product Movements:
- Price Increases:
- Non-electronic cigarettes: +2.3%.
- Other increases: chicken eggs, gasoline, diesel fuel, pharmaceuticals.
- Price Decreases:
- Jet fuel: -10.5%.
- Meats, electric power, hay, hayseeds, oilseeds, and nonferrous scrap prices also declined.
Gold Live Chart