Gold Triangle Breakout Imminent As Range Narrows
Gold made a record-high a month ago above $2,530, but it has formed a resistance zone there, while highs are getting higher, forming a triangle. Global economic and fundamental uncertainties remain quite elevated, which is keeping Gold bid, as buyers keep jumping in at a higher level after every retrace, however, they’re not confident enough to make the break above August’s high just yet.

The 20-day Simple Moving Average (SMA) has provided consistent support for GOLD (XAU) over the past month, as every daily candlestick has closed above it, despite occasional dips below. After last Friday’s decline, following the US Non-Farm Payrolls (NFP) report, the 20 SMA held firm. During yesterday’s European session, XAU/USD surged to $2,528.88, buoyed by a decline in US Treasury yields ahead of the August Consumer Price Index (CPI) release.
However, buyers were once again unable to break the resistance. Following the CPI data release, gold prices fell as the US dollar and Treasury yields strengthened. This shift came as markets dialed back expectations for a significant rate cut from the Federal Reserve in their upcoming meeting.
Gold Chart Daily – The Resistance Zone Continues to Hold
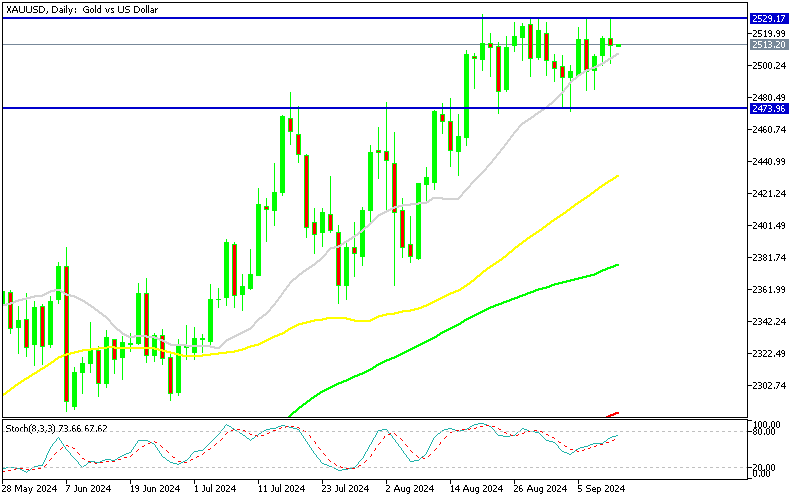
While the headline CPI showed a decrease, core inflation remained sticky, making it less likely that the Fed would opt for a more aggressive half-point rate cut. According to the CME FedWatch tool, market expectations now strongly favor a 25 basis point cut, with a 90% probability—up from around 70% before the CPI data was released. This core CPI uptick has almost guaranteed a modest 25 bps reduction in rates next week.
As a result, the price of GOLD reversed lower after another failure at $2,530, falling to $2.501.15, however sellers couldn’t push the price below the big round level and XAU moved higher again, climbing to $2,520. This shows once again that Gold is in demand. The Russian president Vladimir Putin also helped commodities late in the day, saying that Russia could sanction exports for certain metals as a retaliation to the West. So, the triangle in Gold in getting narrower as the lows get higher, while we have a resistance area around $2,530 and soon we will see a breakout, most likely to the upside.
Gold Live Chart