WTI Crude Oil Forecast: Will $76.66 Resistance Trigger a Bullish Breakout?
Arslan Butt•Friday, August 30, 2024•2 min read
Oil prices saw modest gains on Friday as the market grappled with supply uncertainties stemming from the Middle East.
Libya, which has been a significant oil producer, saw more than half of its output—approximately 700,000 barrels per day (bpd)—go offline due to escalating tensions between rival factions.
Consulting firm Rapidan Energy Group projects that Libyan production losses could escalate to as much as 1 million bpd in the coming weeks.
Adding to the supply-side concerns, Iraq announced plans to reduce its oil output after surpassing its OPEC+ production quota.
Iraq’s production is expected to decrease to between 3.85 and 3.9 million bpd starting next month. These combined factors threaten to tighten global oil supplies significantly.
Despite the supply challenges from Libya and Iraq, oil prices have struggled to gain substantial traction, largely due to weakening demand from China. As the world’s largest importer of crude oil, China’s sluggish economic outlook is casting a shadow over global oil demand.
Analysts have pointed out that China’s diminished appetite for crude is a strong counterbalance to the supply disruptions in the Middle East.
U.S. inventory data has also contributed to a bearish market sentiment. The crude stock draw for the week ending August 23 was about a third smaller than expected, signalling that the anticipated boost in demand has yet to materialize.
Consequently, Brent and WTI crude prices are on track for declines of 0.7% and 2.3%, respectively, for August—marking their second consecutive monthly drops.
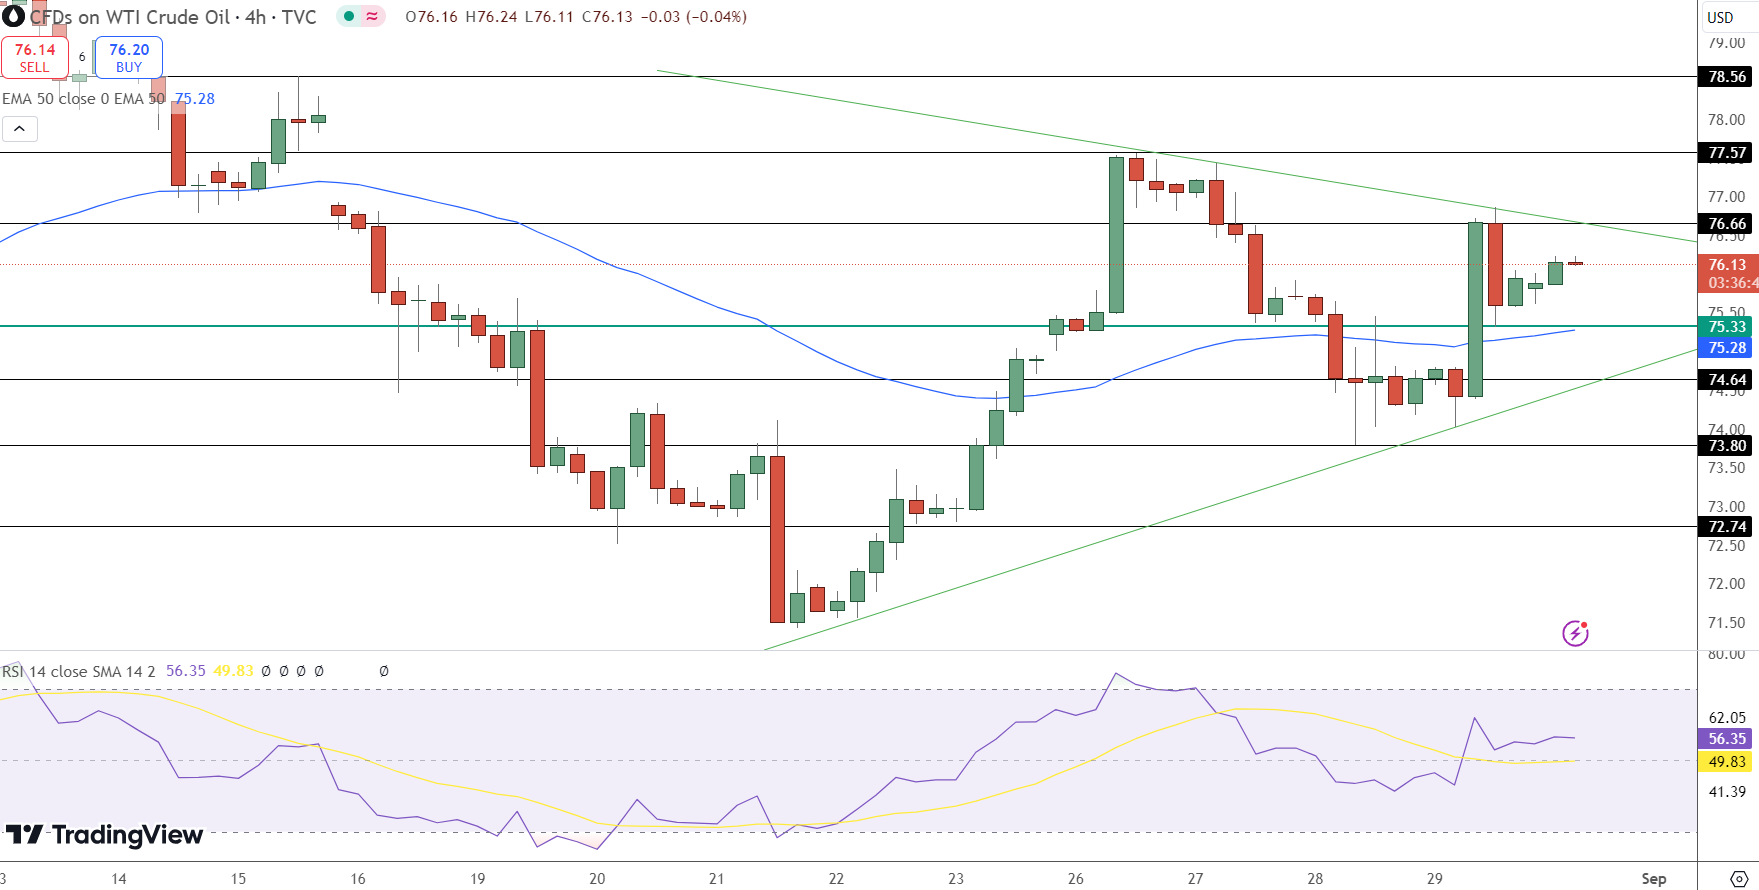
Technical Analysis: Key Levels to Watch in WTI Crude Oil
WTI Crude Oil is currently trading around $76.13, facing a critical juncture on the 4-hour chart. The price is caught between a descending trendline and the 50-period Exponential Moving Average (EMA) at $75.28, creating a potential setup for a significant breakout. The Relative Strength Index (RSI) is hovering just below the neutral 50 mark, indicating a lack of strong momentum but leaning slightly bearish.
Crude oil is trading sideways, unsure of the next direction. Concerns about economic slowdowns in China and the U.S. are weighing on prices. However, a bullish outlook remains if the price can sustain above the demand zone. 📈 #Usoil#crudeoil#technicalanalysis#marketwatch… pic.twitter.com/GQXzOZ903r
Key resistance is found at $76.66, and a breakout above this level could propel the price toward $77.57 and possibly $78.56, continuing the bullish momentum observed earlier in the week.
Conversely, failure to surpass $76.66 could lead to a pullback towards the $75.28 support level. If this support fails, further declines could test the $74.64 and $73.80 levels.
Traders should closely monitor these key technical levels, as a decisive move will likely set the tone for the upcoming trading sessions.
The ongoing geopolitical tensions and shifting demand dynamics will continue to influence market sentiment, making the next few days crucial for determining the direction of oil prices.
Arslan Butt serves as the Lead Commodities and Indices Analyst, bringing a wealth of expertise to the field. With an MBA in Behavioral Finance and active progress towards a Ph.D., Arslan possesses a deep understanding of market dynamics.
His professional journey includes a significant role as a senior analyst at a leading brokerage firm, complementing his extensive experience as a market analyst and day trader. Adept in educating others, Arslan has a commendable track record as an instructor and public speaker.
His incisive analyses, particularly within the realms of cryptocurrency and forex markets, are showcased across esteemed financial publications such as ForexCrunch, InsideBitcoins, and EconomyWatch, solidifying his reputation in the financial community.