Ethereum Price Slumps Despite Whale Accumulation: Technical Analysis Points to Further Decline
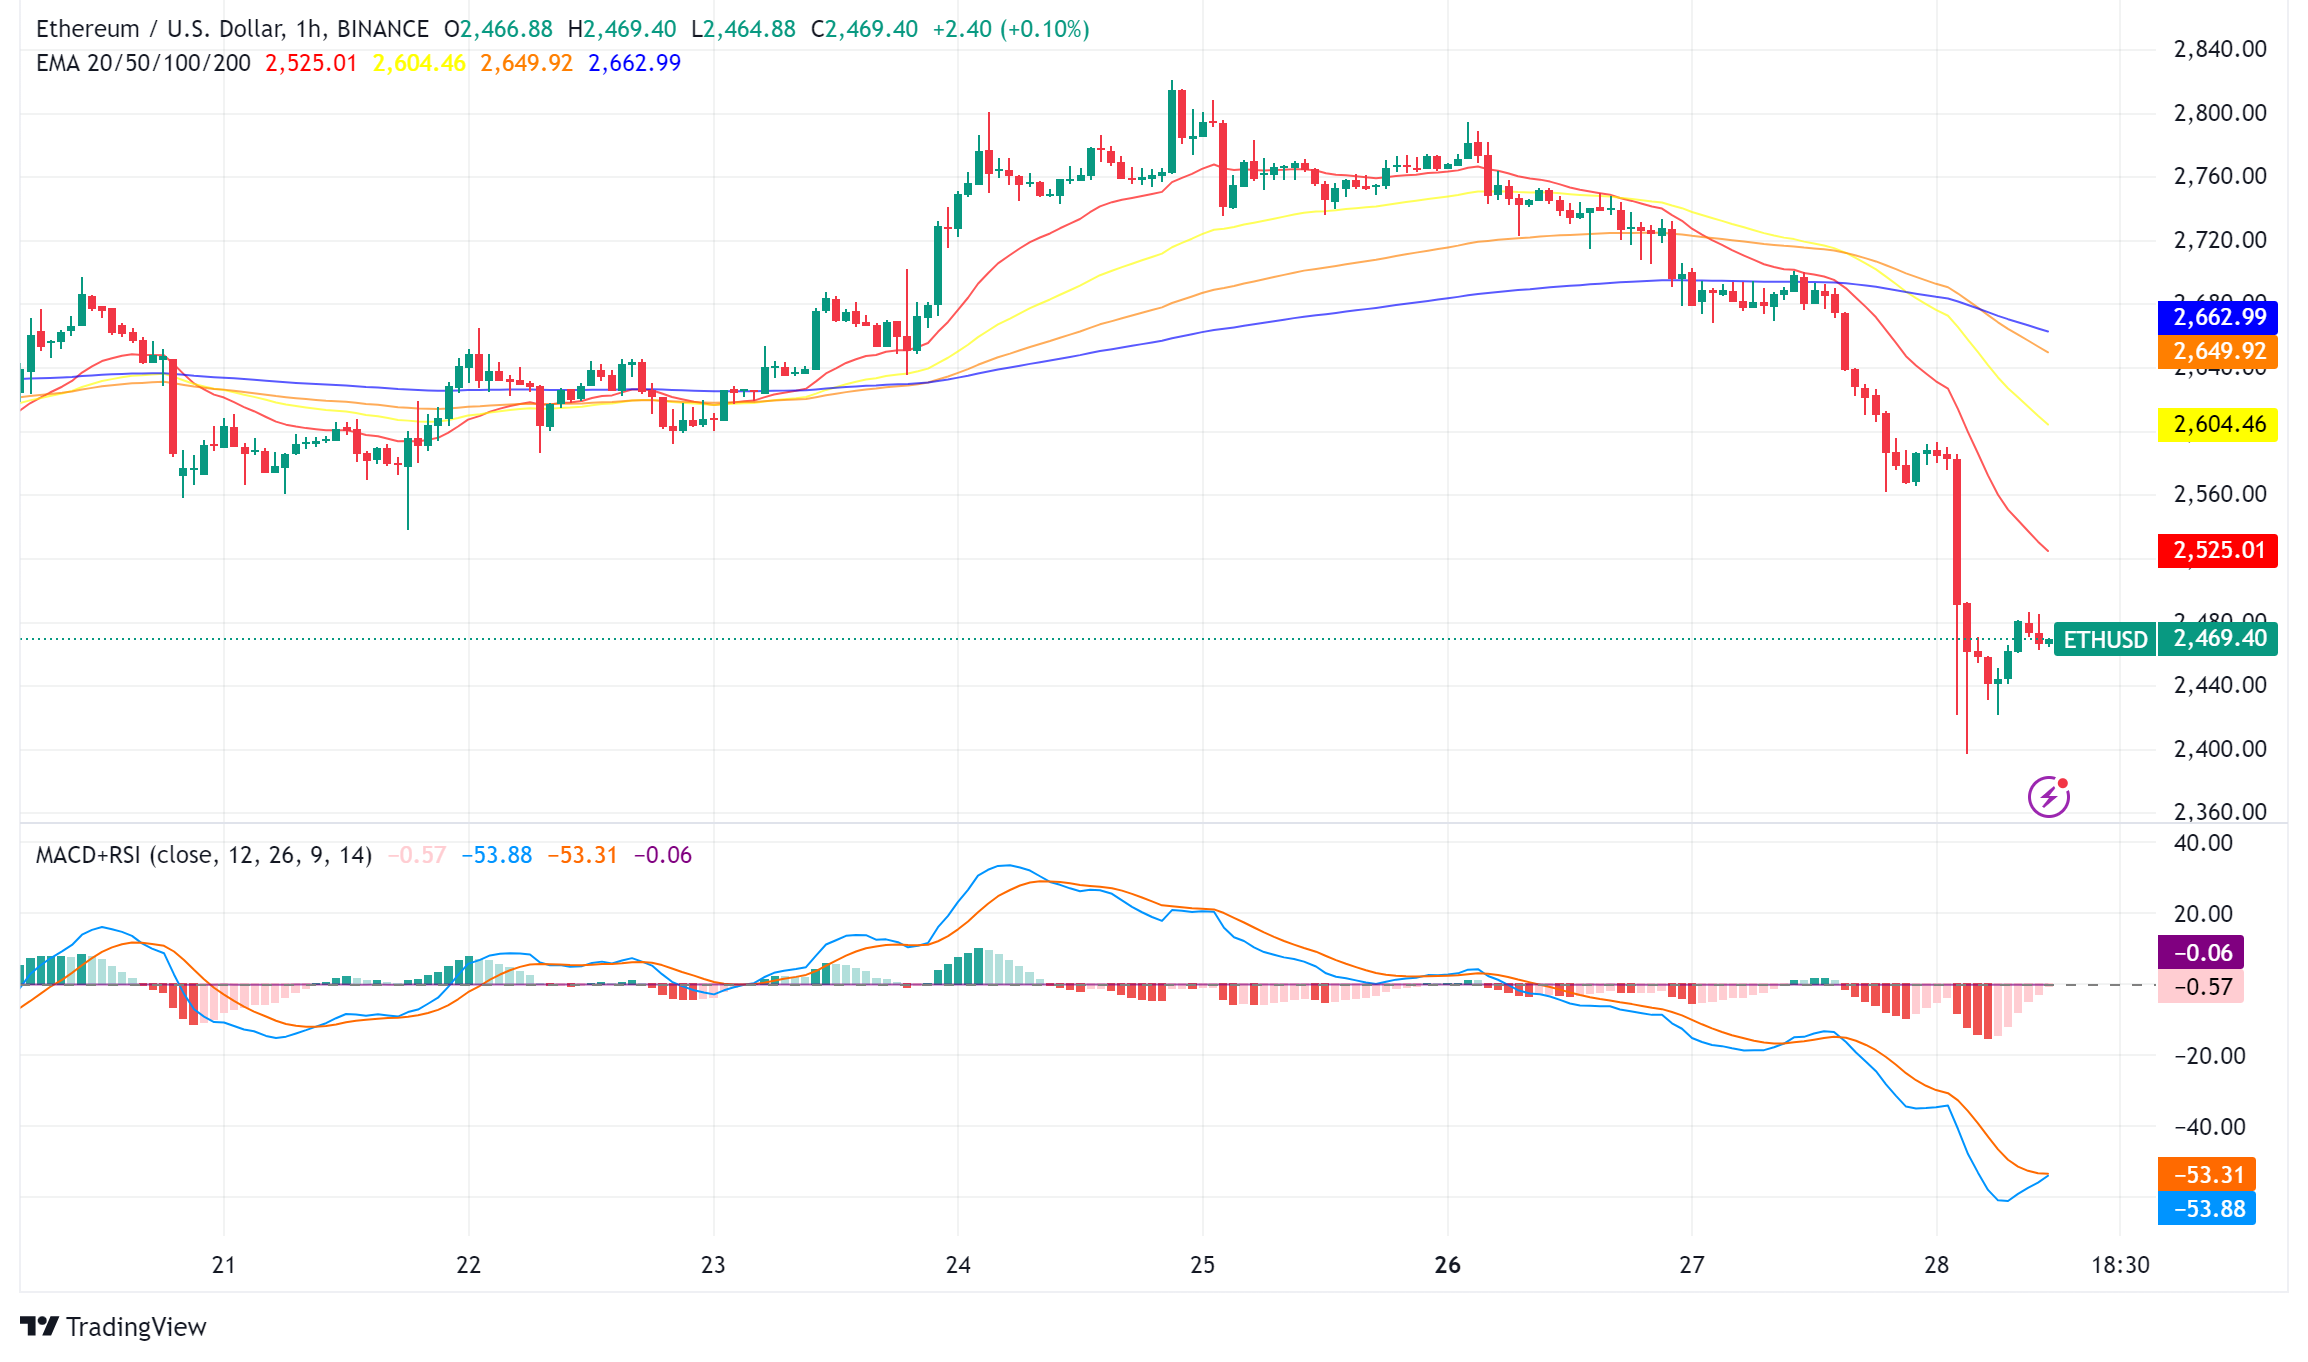
Ethereum (ETH), the world’s second-largest cryptocurrency by market capitalization, is trading around $2,464, down over 8.5% in the past 24 hours. While whale accumulation provides a glimmer of hope, the current technical analysis and investor behavior suggest a potentially volatile period for Ethereum in the near future.
Ethereum Price Drops Amid Mixed Whale Activity
While large investors, known as whales, have been accumulating significant amounts of Ether over the past few days (over 200,000 ETH worth over $540 million), the price has fallen by over 8%. This unexpected move has left analysts questioning the market sentiment around Ethereum.
On-chain data reveals accelerated profit-taking by Ethereum whales in recent days, possibly due to fears of further price declines in September. Large investors like Wintermute have been observed depositing significant amounts of Ether onto exchanges, potentially for selling purposes.
Spot Ether ETFs See Low Demand
The launch of spot Ether ETFs in the United States, which was anticipated to drive up the price, has seen underwhelming participation. The nine US spot Ether ETFs have witnessed a net outflow of nearly $500 million, indicating a lack of significant demand from traditional investors.
ETH/USD Technical Analysis Paints a Bearish Picture
Several technical indicators suggest a potential continuation of the downtrend for Ethereum in the near term. These include:
- Death Cross: The daily chart shows a “death cross” where the 50-day Moving Average (MA) has fallen below the 200-day MA, signifying bearish momentum.
- RSI Rejection: The Relative Strength Index (RSI) on the daily chart recently attempted to break above 50 but was rejected, indicating control by sellers.
- Key Resistance: The $2,700 level remains a significant resistance point for Ether, and a break above it is crucial for a potential price reversal.
Looking Ahead: Support Levels and Recovery Potential
Despite the current downtrend, some analysts believe that a recovery is still possible if the price stays above the $2,400 support zone. Key resistance levels to watch include $2,550 and $2,660. A break above these levels could trigger a short-term price increase.
Sidebar rates
Related Posts
