The NASDAQ Drops 6% On Monday! Will the decline hold?
The NASDAQ began the day with a bearish price gap of 0.85% and then dropped an additional 5.33%, bringing it nearly 17% below its recent high and to its lowest level since April 25, 2024. What is driving this bearish sentiment?
Three main factors have triggered this risk-off sentiment:
1. US Employment Data: The latest figures suggest economic weakness for the rest of 2024. The US Unemployment Rate rose from 4.1% to 4.3%, higher than the predicted 4.1% and the 6-month average of 3.9%. Additionally, the NFP figure fell to 114,000, the lowest since February 2021 and below market expectations. While this data doesn’t yet indicate a recession, it signals stagnation, prompting investors to cash in profits from the past three years.
2. Middle East Escalation: Rising tensions in the Middle East, with a potential Iranian attack on Israel in retaliation for the killing of a Hamas leader, are causing global market jitters. The uncertainty of Iran’s response and its implications for regional peace are negative for the stock market.
3. Berkshire Hathaway Actions: The company confirmed it sold almost half of its Apple stocks and continues to reduce its exposure to Bank of America by nearly 9%. The latest quarterly report shows a shift towards currencies and other sectors.
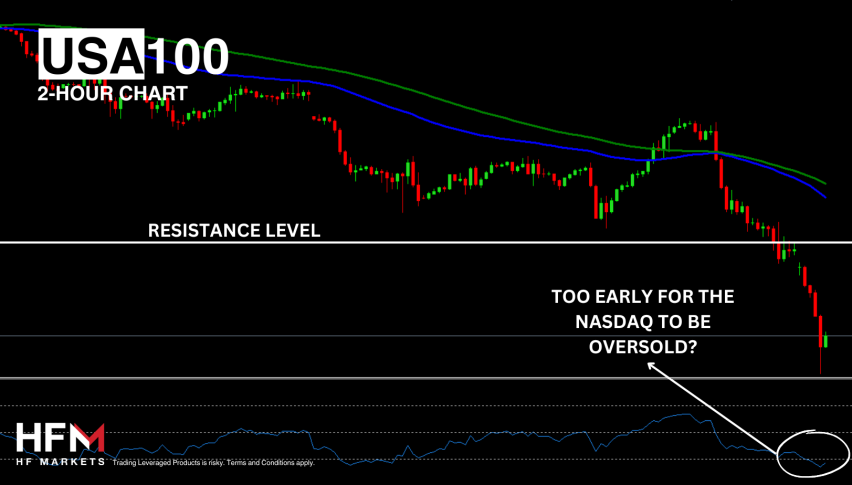
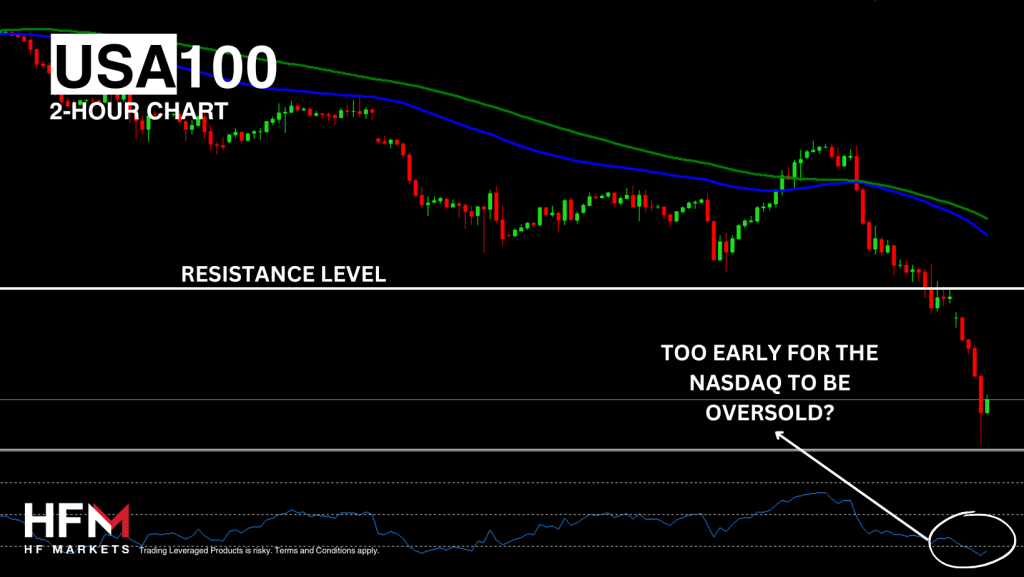
Investors now question the intrinsic value of the NASDAQ and when to buy the dip. Typically, significant price stress without a market crash leads investors to look at clear support levels or the 12-month average price. The nearest support level is at $16,953.30, 3.34% below the current price, and the 12-month average is $17,133.00. Trend indicators point to a continued downward trend unless buyers reenter the market. The 5-minute timeframe using Fibonacci Levels and Crossovers indicates strong sell trades if the price falls below $17,378.22.
However, buyers are likely to re-enter only if Middle East tensions subside and US economic data improves. Throughout the day investors will be concentrating on the US final Services PMI and ISM PMI. Currently, only 10% of the NASDAQ’s Stocks are not experiencing a decline in pre-trading hours. In addition to this, the VIX index points towards a clear risk-off sentiment within the market.
- Check out our free forex signals
- Follow the top economic events on FX Leaders economic calendar
- Trade better, discover more Forex Trading Strategies
- Open a FREE Trading Account
Related Articles


Comments
Sidebar rates
Related Posts
