


Forex Signals Brief July 26: US PCE Inflation Closes the Week
Yesterday it started with the German IFO Business Climate index, which showed another slowdown, against expectations for an improvement this month. However, the Euro held its ground well against most major currencies yesterday, despite private loans also missing expectations.
In the US session, we had the Q2 GDP, with growth for the second quarter coming in at 2.8%, exceeding expectations of 2.0%. This growth was largely driven by investment, which contributed 1.4%, and consumer spending, which added 1.57%. However, inventory accumulation within the investment sector boosted the overall GDP figure by approximately 0.8%, meaning that growth excluding inventories was closer to the trend rate of 2.0%.
For the first quarter, GDP was 1.4%, but this figure was reduced by a -0.42% impact from inventories, resulting in an ex-inventory growth rate of 1.82%. Therefore, while the first quarter’s growth exceeded expectations, the second quarter’s growth fell short of the headline 2.8% when excluding the impact of inventories.
Further into the USD data, we saw a -6.6% decline in durable goods, influenced by the volatile transportation sector. Weekly initial unemployment claims dropped to 235K from 245K the previous week, and continuing claims were also lower than expected, suggesting that the employment sector is not weakening further.
In the stock market, the negative trend continued a day after broader indices had their worst day since late 2022. The S&P 500 fell by -28 points, or -0.49%, and the Nasdaq dropped another 159 points, or around -1%, following a -3.5% decline yesterday. The market saw some relief from deeper losses, as the Nasdaq was down more than 300 points at its session lows. The ongoing decline in the stock market has increased demand for safe-haven assets, with the Swiss franc (CHF) emerging as the strongest major currency today.
Today’s Market Expectations
Yesterday the USD retreated lower during the Asian and European sessions, but made a reversal in the US session, which in the end left most assets trading in a narrow range. The volatility was lower as well, so we only had two trading signals reaching their targets, both of which hit the take profit, while several other trades remained open.
Gold Stretches the Downside
Yesterday, gold prices saw an increase during the early U.S. session, peaking at $2,430 from an initial low of $2,400. This rise was part of a broader trend toward safer investment options, as investors sought the traditional safe-haven asset following declines in global stock markets. Despite breaking above the 50-day SMA, gold failed to sustain its upward momentum and reversed course, forming a doji candlestick, a bearish reversal signal. Later in the U.S. session, XAU/USD fell back into its previous range, breaking below the 100-day SMA and dipping below $2,400.
XAU/USD – H4 chart
EUR/GBP Finds Buyers Below 0.84 Again Falls to the Bottom of the Previous Range
Last month, EUR/GBP made a notable upward retracement, closing the previous negative gap and gaining over a cent. However, this upward momentum was short-lived. The pair reversed in July after failing to breach the 50-day Simple Moving Average (SMA), indicating a lack of bullish momentum and leading to a decline for the month. The price briefly tested the 0.84 level before recovering, rising by 50 pips above this threshold. Despite this bounce, which shows some buying interest near the 0.8382 level, the overall outlook remains bearish as long as the pair stays below the 0.8498 resistance. The broader downtrend is expected to continue, potentially pushing the pair below the 0.8382 mark in the future.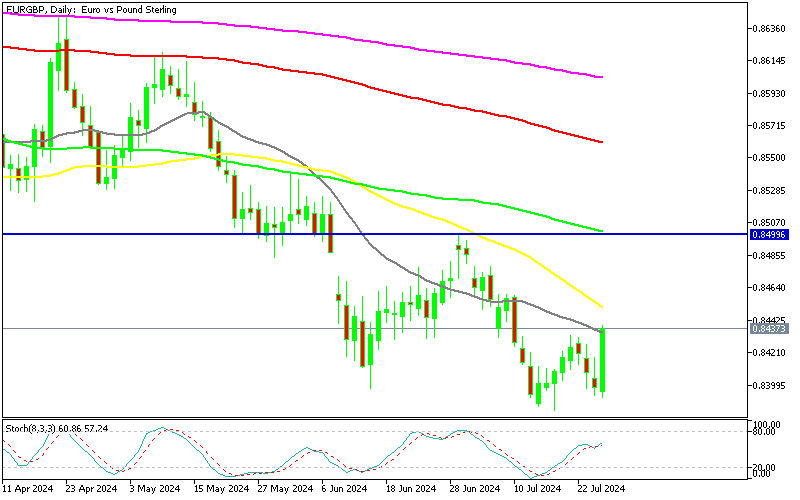
EUR/GBP – H4 Chart
Cryptocurrency Update
Bitcoin Stays at $65,000 As MAs Hold
Earlier this month, Bitcoin experienced a sharp decline, dropping below $60,000 and contributing to a broader downturn in the cryptocurrency market, eventually hitting lows of under $53,000. However, buyers soon returned, driving the price back above $60,000 and surpassing key moving averages. The recovery paused slightly above $65,000, but Bitcoin found support at the 100-day Simple Moving Average (SMA) on the daily chart, which enabled it to continue its ascent, reaching $68,000 over the weekend.
BTC/USD – Daily chart
Ethereum Tumbled Toward $3,000
Despite the launch of the ETH ETF, Ethereum has been experiencing a series of lower highs since early March. After reaching a peak of $3,830, Ethereum’s price fell below $3,000 in June. Buyers then re-entered the market, pushing the price up to the 50-day SMA, a level that had previously acted as resistance. The persistence of buyers has since turned the 50-day SMA into a support level for Ethereum.
ETH/USD – Daily chart


| Broker | Website | |
|---|---|---|
| 🥇 |  | Visit Broker |
| 🥈 | Visit Broker | |
| 🥉 |  | Visit Broker |
| 4 |  | Visit Broker |
| 5 |  | Visit Broker |
| 6 |  | Visit Broker |
| 7 |  | Visit Broker |
