


Forex Signals Brief July 23: US Home Sales to Resume the Decline
The weekend’s headline event was Joe Biden’s withdrawal from the Democratic presidential race and the subsequent endorsement of Vice President Kamala Harris. Yesterday’s markets saw no major economic data releases. Harris is now almost certain to secure the nomination, as other party officials have also voiced their support. This opened the door for her to receive the nomination.

The announcement led to a surge in US stock markets, fueled by speculation that Harris, who favors a balanced and less regulated market, would be more favorable to big tech. Consequently, both the Nasdaq index and the small-cap Russell-2000 saw gains of over 1.60% for the day.
Today’s Market Expectations
Today the economic calendar is light again, although we have some releases in the US session. It starts with the Consumer Confidence from the Eurozone, which is expected to improve slightly, continuing the improving trend, however, the sentiment is still negative, which shows that the European consumer is in difficulty.
The US Existing Home Sales is the main event today, which are expected to resume the downtrend after the jump last month. The consensus for existing home sales in the United States is projected at 3.99 million, down from the previous 4.11 million. The outlook remains grim, with last month’s figure showing a 0.7% decline, mainly due to a drop in single-family home sales.
Higher mortgage rates and increasing prices continue to pressure the housing market, and this trend is expected to continue in this week’s report. New home sales have also seen a decline recently. This week’s forecast is 643K, up from the previous 619K. Analysts from Wells Fargo note that “an increasing number of builders have been offering financial incentives, including price discounts and mortgage rate buy-downs in recent months, but persistent higher rates seem to be hampering their efforts.
Yesterday the main pairs such as EUR/USD and GBP/USD remained in a tight range, however, commodity dollars declined as the Chinese yuan weakened, following the PBOC lowering interest rates. We opened nine trading signals in total, with five forex signals closing in profit while four closed in loss.
Gold Retreats $40 After Printing A New High
Gold hit a fresh record high last Wednesday, but then reversed course, declining for four consecutive days. The price fell below $2,400 yesterday, potentially signaling a further drop towards June’s lows of $2,300. However, the 50-day SMA might limit the decline. After peaking, gold began to decline gradually by midweek. The pullback intensified on Friday following an earlier surge in July, with gold prices dropping by $50 to a low of $2,394 and closing at $2,400. After a three-day downtrend, XAU/USD opened with a slight positive gap, reaching an intraday high of $2,411.91. Nevertheless, the 20-hourly SMA rejected this price, leading to a swift fall below $2,400 once more.
XAU/USD – Daily chart
The Decline in AUD/USD Accelerates
The AUD/USD ended the week at 0.6683, down nearly 1.4%, due to unfavorable risk sentiment. Disappointing Q2 GDP estimates from China have heavily impacted the Australian dollar, given its strong economic ties with China. Additionally, falling commodity prices, especially iron ore, which declined by more than 4% in July, have negatively affected commodity-linked currencies. Yesterday, the People’s Bank of China reduced both one- and five-year loan prime rates which pulled commodity dollars down, with AUD/USD falling to the 100 SMA on the daily chart.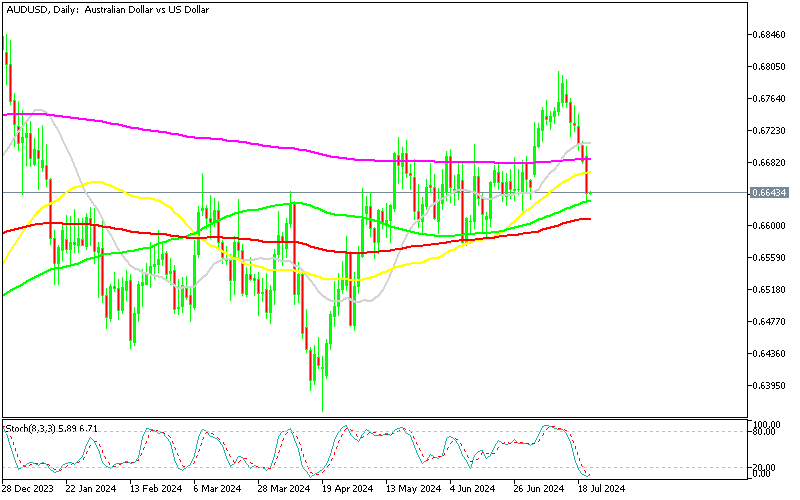
AUD/USD – Daily Chart
Cryptocurrency Update
Bitcoin Consolidates Around $68,000
Bitcoin fell below $60,000 following a sharp decline earlier this month. The entire cryptocurrency market value dropped, with Bitcoin falling to under $53,000. However, buyers quickly returned, pushing the price back above $60,000 and past critical moving averages. The reversal paused at $65,000 briefly, but the 100 SMA (green) turned into support on the daily chart, and BTC resumed its upward movement, reaching $68,000 over the weekend.
BTC/USD – Daily chart
MAs Turn into Support for Ethereum
Despite the introduction of the ETH ETF, Ethereum has been experiencing lower highs since early March. It peaked at $3,830 before declining in June and falling below $3,000 earlier this month. Buyers then stepped in, driving the price up to the 50-day SMA (yellow), which initially acted as resistance. However, the buyers persisted, and now the 50 SMA is providing support.
ETH/USD – Daily chart


| Broker | Website | |
|---|---|---|
| 🥇 |  | Visit Broker |
| 🥈 | Visit Broker | |
| 🥉 |  | Visit Broker |
| 4 |  | Visit Broker |
| 5 |  | Visit Broker |
| 6 |  | Visit Broker |
| 7 |  | Visit Broker |
