


Forex Signals Brief July 18: Focus on Employment and ECB Today
Yesterday we had the main economic data releases early in the Day, with the New Zealand CPI consumer inflation falling more than expected in Q2, while UK inflation remained unchanged, with expectations for a slight slowdown. However, both the GBP and the NZD ended up higher at the end of the day.

However, they trailed safe haven currencies such as the CHF and the JPY, which benefited from the dive in risk sentiment, sending stock markets crashing lower. The Nasdaq experienced its most significant drop since 2022 on Wednesday, as market volatility surged. US lawmakers targeted semiconductor manufacturers, with President Biden indicating a readiness to tighten regulations on chip exports to China. This led to the Nasdaq reaching its lowest close since June 4.
ASML saw a 12% drop, Qualcomm fell by 9%, and Nvidia decreased by around 6.5%. Despite the stock market upheaval, only safe haven currencies appreciated, without a broader market impact. Additionally, Federal Reserve officials continued to suggest that a rate hike in September is possible, contingent on forthcoming economic data. As a result, USD/JPY fell by 2 cents, closing at 156.00.
Today’s Market Expectations
The Australian employment report is expected to show an addition of 20K jobs in June, compared to 19.9K in May, with the unemployment rate expected to tick higher to 4.1% from 4.0% in May. This shouldn’t affect policy expectations as the focus remains on the Australian Q2 CPI report due on July 31st.
The UK Labour report is anticipated to reveal an increase of 23.4K jobs in June, following a decrease of 140K in May, with the unemployment rate remaining stable at 4.4%. Attention will be on wage growth, with Average Earnings including Bonus projected at 5.7%, down from 5.9%, and Average Earnings excluding Bonus expected at 5.7%, down from 6.0%. However, slowing wage growth or weak employment figures could increase expectations for monetary easing by the BOE, with the market pricing in 49 basis points of cuts by the end of the year.
The European Central Bank (ECB) is expected to maintain interest rates at 3.75%. ECB officials have consistently indicated that no actions will be taken in July as they await further data. Consequently, this meeting is expected to be uneventful, with the next fully open meeting scheduled for September. The market anticipates an additional 45 basis points of easing by year-end.
The US Jobless Claims report remains a crucial weekly indicator of labor market conditions. Since 2022, initial claims have stayed relatively stable around cycle lows, ranging between 200K and 260K. However, Continuing Claims have been steadily rising, consistently reaching new cycle highs each week, despite a slight decline last week. This trend suggests that layoffs are not increasing rapidly and remain moderate, while hiring is slowing. This week’s initial claims are projected at 235K, up from 222K previously, indicating a potential shift worth monitoring.
Yesterday the volatility picked up, particularly in safe havens, with Gold printing a new all-time high, while USD/JPY dived around 200 pips lower. We opened seven trading signals, and closed the day with four winning forex signals and three losing ones, as prices chopped around in the us session.
A New Day and A New Record High in Gold
Gold continued the surged yesterday with a $15 gain, as the price printed a new record high at $2,483, more than $40 on Thursday, breaking past $2,400following the break of the previous record high on Tuesday. However, we saw a retreat in the US session, which sent the price amore than $30 lower to $2,451, where the 50 SMA (yellow) held as support on the H1 chart.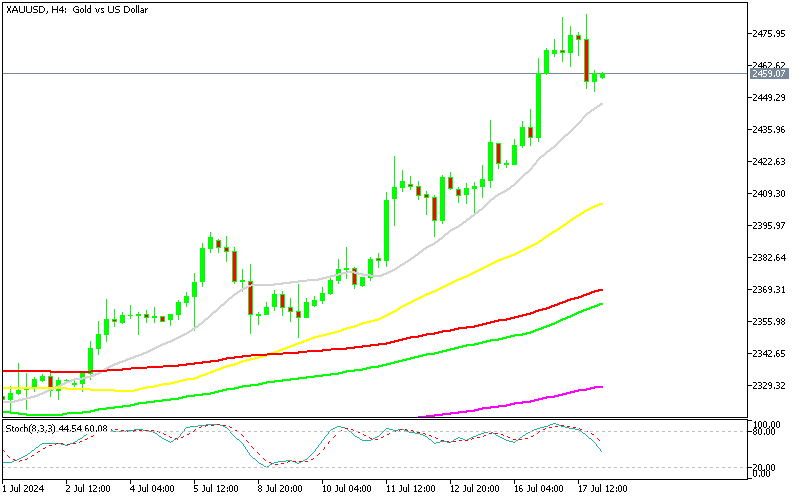
XAU/USD – Daily chart
NZD/USD Bouncing Off the 100 SMA
The previous surge in USD/CHF was driven by the Swiss Franc’s ongoing weakness after the Swiss National Bank (SNB) implemented two consecutive rate cuts in recent meetings. However, the pair has declined over the past two months as the likelihood of the Federal Reserve cutting interest rates has increased due to the weakening US economy. Meanwhile, traders anticipate the SNB will halt rate reductions, providing additional support to the CHF. After briefly rising above the 50-day Simple Moving Average (SMA) (yellow) in May, the price has since dropped to lows of 0.80, falling below all moving averages on the daily chart. Yesterday, the decline intensified, with the pair falling 100 pips, forming a significant bearish candlestick. 
NZD/USD – Daily Chart
Cryptocurrency Update
Bitcoin Stabilizes Above 65K
Bitcoin, which had previously found solid support around $60,000, has recently experienced a significant decline. Cryptocurrency values have dropped this week, with Bitcoin falling below $60,000 yesterday and continuing its descent today, nearing levels last seen in early May. A rapid drop below $57,000 suggests a potential broader breakdown in the chart pattern. The 200-day moving average (purple line), breached in May but previously steady at $57,000, is again under threat. However, the initial support at $58,000 held firm during the first test. A sustained drop below this level—the most substantial breach since last October—would indicate a shift in Bitcoin’s downward momentum. Despite this, buyers have re-entered the market, pushing prices back above the moving averages.
BTC/USD – Daily chart
Ethereum Approaches $3,500
Since the introduction of its ETF, Ethereum (ETH) has experienced considerable volatility, hitting a peak of $3,832.50. The rally was driven by improved market sentiment following the SEC’s approval of spot Ethereum ETFs. Despite a 25% increase from its previous high, ETH has now fallen below $3,000. Currently, it is rebounding from this critical level. To establish a long-term upward trend, buyers need to push ETH above the 50-day Simple Moving Average (SMA), represented by the yellow line.
ETH/USD – Daily chart


| Broker | Website | |
|---|---|---|
| 🥇 |  | Visit Broker |
| 🥈 | Visit Broker | |
| 🥉 |  | Visit Broker |
| 4 |  | Visit Broker |
| 5 |  | Visit Broker |
| 6 |  | Visit Broker |
| 7 |  | Visit Broker |
