Bitcoin Price Tumbles on Weekend Trading, Mt. Gox Repayments Loom Large
Bitcoin (BTC), the world’s largest cryptocurrency by market capitalization, took a tumble over the weekend, falling 6% to $54,600. This decline comes despite a brief price rally that attempted to push the coin above $58,000 on Sunday.
Several factors are contributing to the current market uncertainty. One major concern is the upcoming repayments from the defunct Japanese exchange Mt. Gox. Users who lost funds in the 2014 hack are expected to receive a portion of their Bitcoin Cash (BCH) and Bitcoin (BTC) holdings this month. The total amount to be distributed is estimated at $2.71 billion, and analysts worry that a significant portion of these coins could be sold, further depressing the price.
Adding to the bearish sentiment is potential selling pressure from the German government, which holds a sizeable amount of Bitcoin. Experts are divided on the long-term impact of these sales, with some believing they could mark the bottom of the market.
Another factor influencing the market is the broader economic climate. A liquidity shortfall in Q2 2024 has tightened global financial conditions, potentially impacting crypto prices. Despite the recent drop, some analysts remain optimistic about Bitcoin’s long-term prospects. They view the coin as a hedge against inflation and a potential beneficiary of a weakening US dollar.
Here’s a quick recap of the situation:
- Bitcoin price fell 6% to $54,600 over the weekend.
- Mt. Gox creditor repayments and potential German government sales are causing uncertainty.
- Liquidity concerns and a weakening US dollar are also impacting the market.
- Some analysts remain bullish on Bitcoin’s long-term outlook.
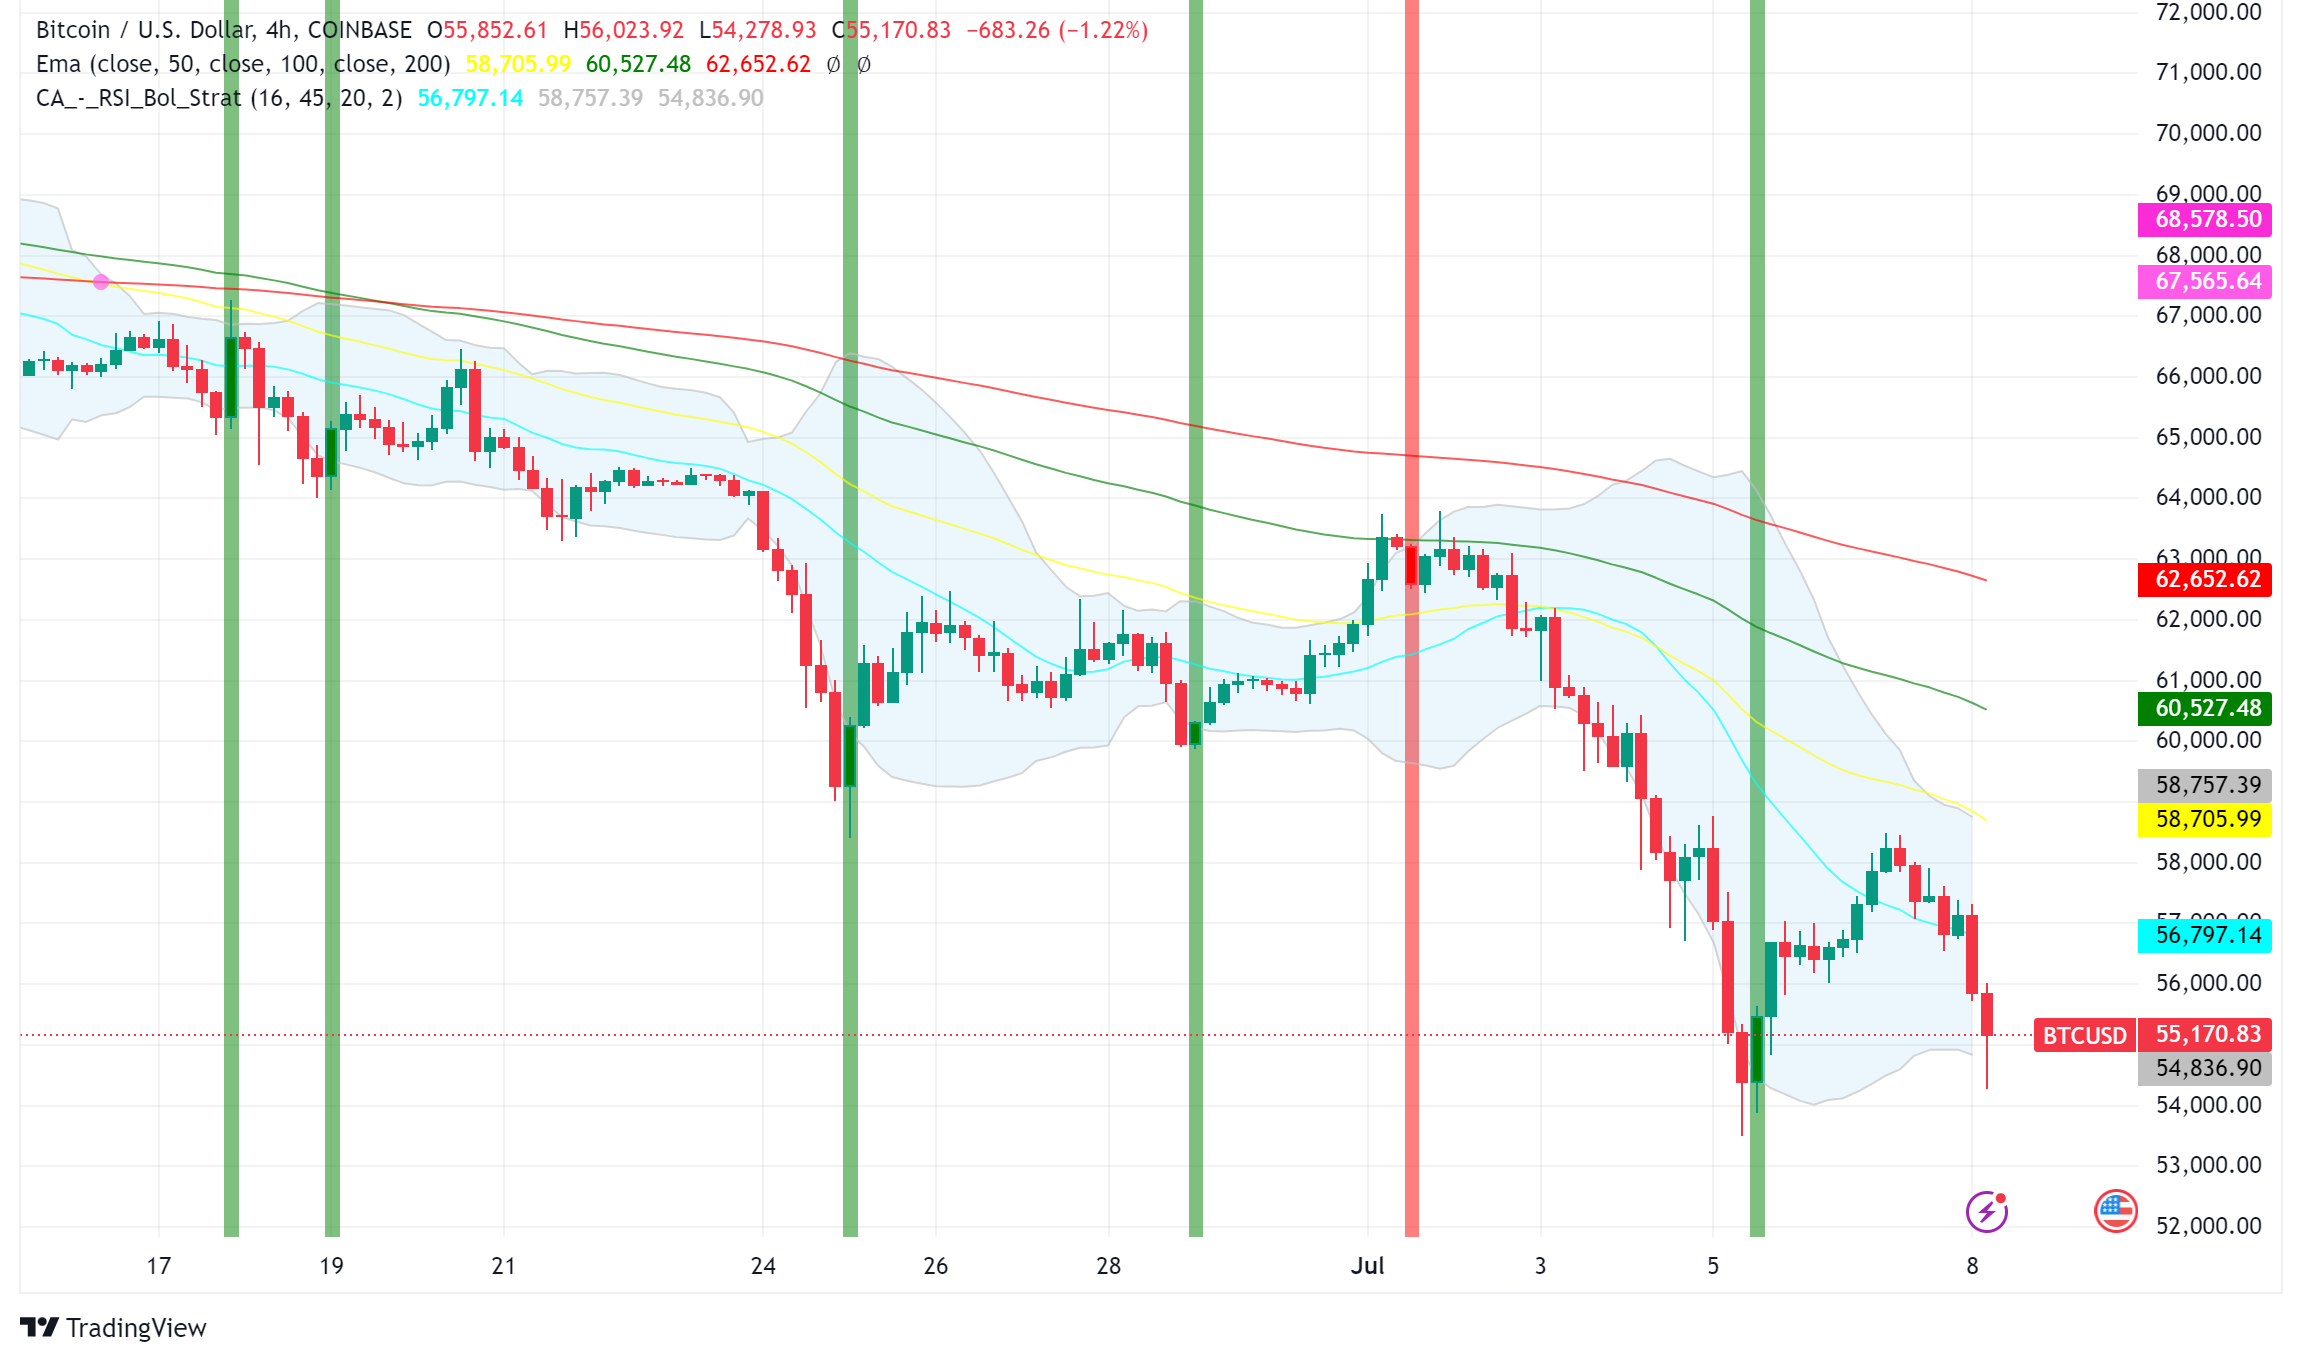
BTC/USD Technical Analysis
Bitcoin (BTC) failed to overcome resistance around $58,500 and is currently trading below key support levels. Here’s a technical breakdown of BTC/USD:
- Price Movement: BTC attempted a rally above $58,000 but faced strong resistance. It dropped below $56,500 and the 100 hourly Simple Moving Average (SMA).
- Support and Resistance: Immediate support sits at $54,400, followed by $53,650 and $53,200. Resistance lies at $56,400 and $58,400.
- Trend Indicators: Both the MACD (Moving Average Convergence Divergence) and RSI (Relative Strength Index) are bearish on the hourly timeframe, indicating downward momentum.
Key Levels to Watch
- A break below $54,400 could see further losses towards $52,000.
- Reclaiming $56,400 is crucial for a potential rebound towards $58,400 and higher.
- A clear break above the downtrend line (around $56,350) might indicate a shift in momentum.