


Rising Gold Prices to $2,365 Amid Federal Reserve Rate Cut Speculation; What’s Next?
Gold prices (XAU/USD) experienced a significant increase, reaching $2,365—the highest level since June 21—during the Asian trading session on Friday.
This surge is attributed to the market’s anticipation of the Federal Reserve potentially lowering interest rates in September and December, following weaker than expected U.S. economic indicators. As a result, the U.S. Dollar (USD) weakened for the fourth consecutive day, dropping to a three-week low, which in turn bolstered the value of gold.
Impact of U.S. Economic Data on Gold Prices
The U.S. economic landscape, particularly recent labor market data, is influencing gold’s pricing dynamics significantly. With the Nonfarm Payrolls (NFP) report expected to show a decrease in job additions—190,000 jobs in June down from 272,000 in May—market sentiment is leaning towards a dovish stance by the Federal Reserve. Moreover, the unemployment rate is projected to remain steady at 4%, while average hourly earnings growth is anticipated to decrease to a 3.9% annual rate from the previous 4.1%.
These indicators have heightened expectations that the Federal Reserve may initiate rate cuts, a scenario that traditionally benefits non-yielding assets like gold. However, comments from several Federal Reserve officials and the contents of the June FOMC meeting minutes suggest a cautious approach towards reducing interest rates, adding complexity to market forecasts.
Market Outlook and Technical Analysis
Despite the positive trend, the global equity market’s bullish sentiment could limit a significant rally in gold prices, as traders might opt for riskier assets. The financial community awaits the detailed U.S. employment data, which will likely dictate short-term movements in the gold market. A weaker than expected jobs report could solidify the case for upcoming rate cuts, further propelling gold prices upwards. Conversely, stronger than anticipated employment data could strengthen the USD, potentially pressuring gold prices downward.
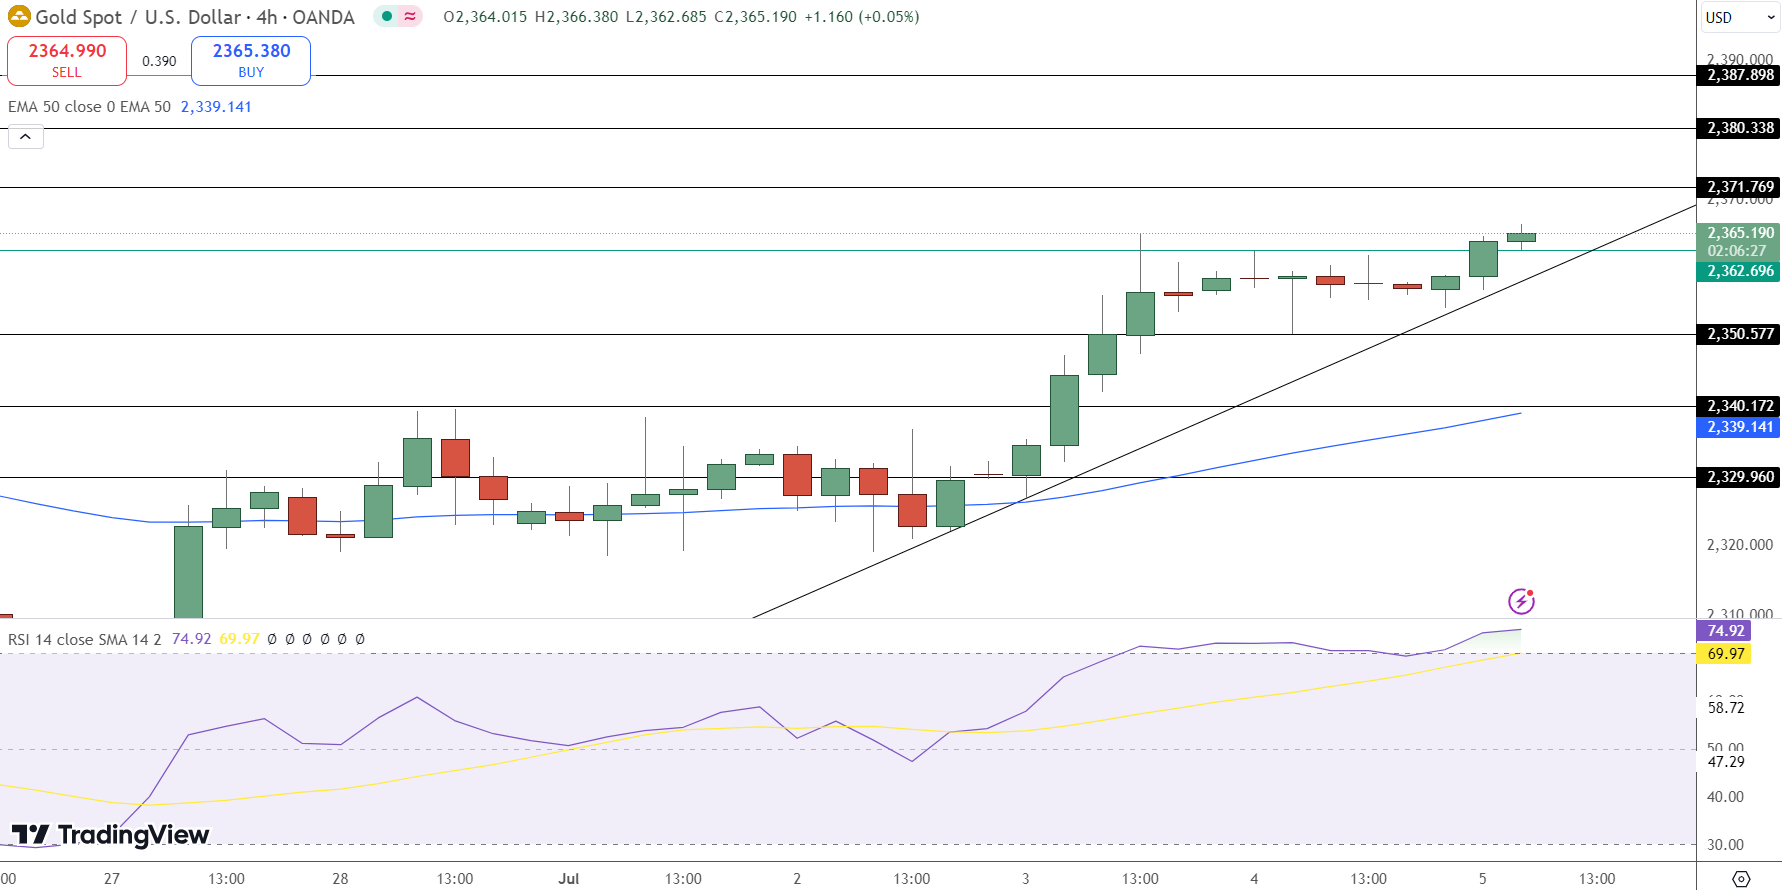
In technical terms, gold remains bullish as long as it stays above the pivot point of $2360.13. Current resistance levels are set at $2366.90, $2374.45, and $2382.14, while key support levels are found at $2354.41, $2346.59, and $2338.70. The 50-day Exponential Moving Average (EMA) at $2345.93 and the 200-day EMA at $2334.42 further suggest a bullish trend. However, a break below the pivot could trigger significant selling pressures, shifting the market sentiment.


🏆 7 Best Forex Brokers
| Broker | Website | |
|---|---|---|
| 🥇 |  | Visit Broker >> |
| 🥈 | Visit Broker >> | |
| 🥉 |  | Visit Broker >> |
| 4 |  | Visit Broker >> |
| 5 |  | Visit Broker >> |
| 6 |  | Visit Broker >> |
| 7 |  | Visit Broker >> |


