Forex Signals Brief July 5: Rolling Up to the NFP Report
Yesterday the main events were the release of the CPI inflation report from Switzerland and the UK Construction PMI, both of which came in softer. But while the former sent the CHF lower, with USD/CHF jumping 40 pips higher, the later didn’t have much effect on the GBP. Cable (GBP/USD) was a focal point on election day, but the driving force over the past two days has been the pound’s recovery, with the election outcome being largely anticipated.

The economic data was light in the US session, but it was surprisingly active for a holiday, likely influenced by the previous day’s disappointing ISM services report and anticipation of tomorrow’s employment data. Adding to the mix were political uncertainties surrounding the US, French, and UK elections, providing much for investors to consider. Consequently, US dollar selling kicked off early and continued throughout European trading, only tapering off as London markets closed.
During the day, several key levels were tested: GBP and AUD neared weekly highs, while USD/CAD hit its lowest point in a month, buoyed by strong oil prices. USD/JPY seemed to find some support from the slowing US economy, experiencing a one-cent drop after Wednesday’s weak ISM services data, with long positions potentially being covered ahead of the non-farm payrolls report. The pair ended the day down half a cent, a rare win for the bears.
Today’s Market Expectations
Today the main event will be the NFP, which will likely decide the fate of the USD for several sessions, into early next week. It is expected that the US Non-Farm Payrolls will show an addition of 180,000 jobs in June, a decrease from the 272,000 jobs added in May, with the unemployment rate remaining steady at 4.0%. The forecast for Average Hourly Earnings on a month-over-month basis is 0.3%, down from the previous 0.4%. The Federal Reserve is closely monitoring the labor market, as they foresee a significant downturn. Recall that the Fed projected an average unemployment rate of 4% for 2024. If unemployment rises to 4.2% in the coming months, it could prompt them to consider a rate cut. Currently, the data suggests a rebalancing in the labor market, with fewer hires than layoffs, but overall, there are no clear signs of a downturn.
It is anticipated that the Canadian labor market data will reveal an addition of 25,000 jobs in June, slightly down from the 26,700 jobs added in May, with the unemployment rate expected to rise to 6.3% from 6.2% in May. Despite another increase in the jobless rate, the most recent report was surprisingly positive. The Bank of Canada (BoC) is primarily focused on wage growth, which recently jumped to 5.1% from 4.7%. This is a crucial factor. Recall that last week’s unexpected increase in the Canadian CPI occurred even as underlying inflation indicators remained within the 1-3% target range. As a result, the market has reduced its expectations for a rate cut, with the likelihood now at 50%. Before the next BoC policy decision, another inflation report will be released. If wage growth jumps again, the central bank will likely need very favorable CPI figures to justify a rate cut in July.
Yesterday was quiet art first but volatility kicked in during the US session. The price action was mixed though, with risk assets being quiet early but reversing in the US session and sending stock markets higher. We opened 8 trading signals yesterday, ending the day with 7 closed trades, 5 of which were winning forex signals and two were losing signals.
Gold Buyers Testing the 50 Daily SMA
Following the soft US economic data, gold prices rose on Wednesday, with XAU surging above the 50-day moving average, which had previously served as resistance and provided good selling opportunities. During the US session, the USD declined after lower-than-expected ADP payroll data and significantly weaker ISM non-manufacturing figures. This led to gold climbing $25.75, or 1.10%, to $2,354.87. However, yesterday, the gold price stalled at these levels, as buyers awaited the release of the NFP (Non-Farm Payroll) numbers to gauge the market’s direction.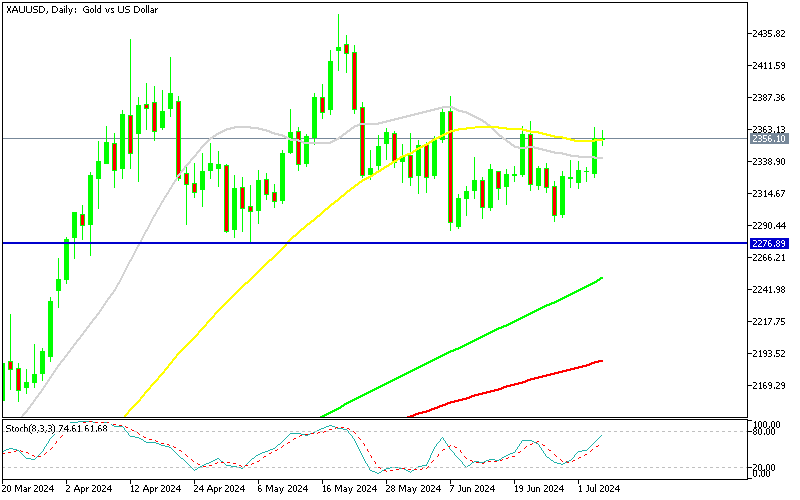
XAU/USD – Daily chart
MAs Keeping USD/JPY Supported During Dips
USD/JPY has surged above the critical 160.00 barrier, driven by minimal intervention from Japanese authorities, which has bolstered market confidence in achieving new highs. Last week, the pair dipped to 160.00 but swiftly recovered as buyers stepped in around 160.20, solidifying this level as a robust support zone. On the 4-hour chart, a minor trendline has emerged, with the 20 SMA (gray) indicating notable buying pressure. However, the 20 SMA was breached yesterday following disappointing US ISM services data, indicating a contraction in the sector for June. This development caused a sharp 100-point decline, pushing the pair below 161. The descent found support just above the 50 SMA (yellow), signaling a bullish reversal. Buyers are expected to look to the 50 SMA to sustain upward momentum and aim for new highs. The recent bounce above the 50 SMA reinforces the positive outlook, suggesting readiness in the market to test higher levels.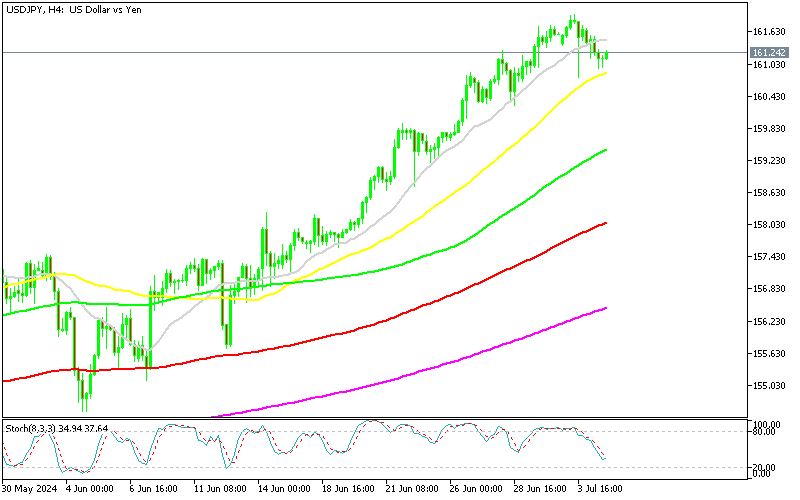
USD/JPY – H4 Chart
Cryptocurrency Update
Bitcoin Breaks below the 200 Daily SMA
Although Bitcoin had found solid support near the $60,000 zone for a while, it has recently taken a sharp turn downward. This week has seen a significant decrease in cryptocurrency values, with prices dropping below $60,000 yesterday and continuing to fall today, reaching the next crucial level from early May. There was a momentary dip below $57,000, which increased the likelihood of a more substantial break on the charts. The 200-day moving average (purple line), which held steady at $57,000 before being broken in May, has again come under threat. However, support at $58,000 held on the first attempt. A sustained decline below this mark, the first significant breach since October last year, would signal a shift toward bearish momentum for Bitcoin. Although buyers still hold some hope, with the May 1 low around $56,500 providing potential support, the breach of the 200-day moving average is likely to embolden sellers, leading to a more aggressive downward move. Consequently, this critical support may not hold for long.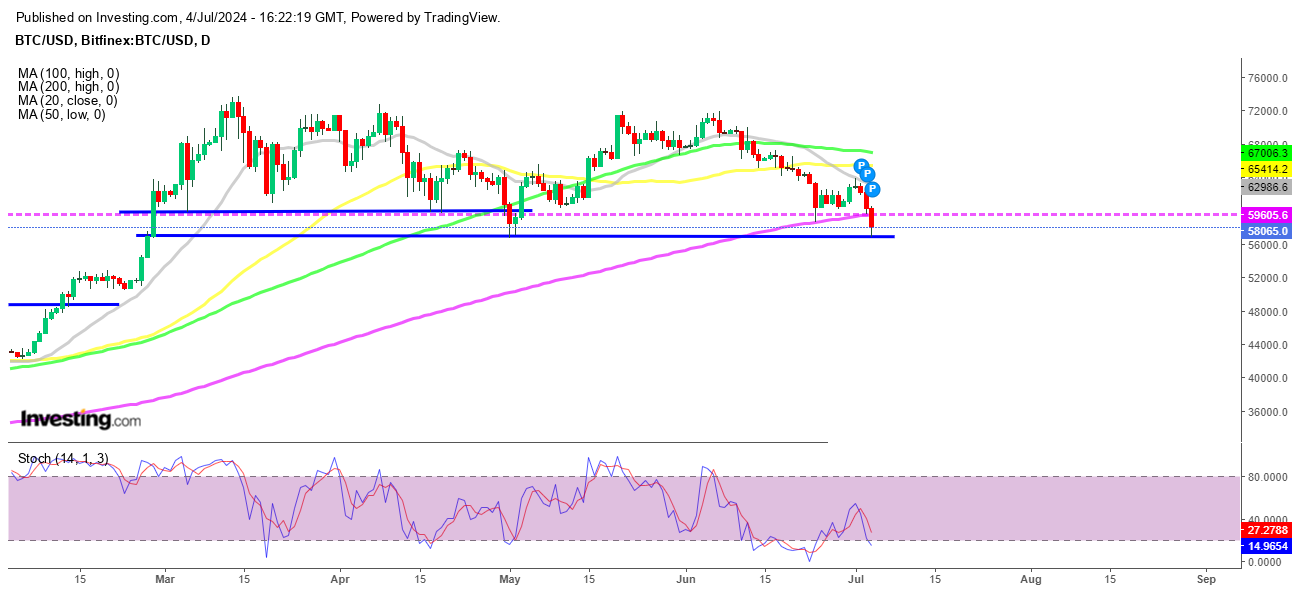
BTC/USD – Daily chart
The 20 SMA Stops Ethereum From Reversing Higher
Ethereum (ETH) has experienced notable volatility since the launch of its ETF, soaring to a peak of $3,832.50. This surge was driven by increased market confidence following the SEC’s favorable decision on spot Ethereum ETFs. ETH has risen by 25% from its previous peak, underscoring robust investor interest and market demand. However, Ethereum has recently slipped below the $3,500 mark. Last week, the 20-week Simple Moving Average (SMA) (represented by the gray line) provided crucial support, and this week, we are witnessing a rebound from that SMA. This suggests a potential stabilization and renewed upward momentum for Ethereum in the short term. However, prospective buyers of ETH will need to surpass the 20 SMA (gray line) to establish a sustainable upward trend.
Yesterday the main events were the release of the CPI inflation report from Switzerland and the UK Construction PMI, both of which came in softer. But while the former sent the CHF lower, with USD/CHF jumping 40 pips higher, the later didn’t have much effect on the GBP. Cable (GBP/USD) was a focal point on election day, but the driving force over the past two days has been the pound’s recovery, with the election outcome being largely anticipated.
The economic data was light in the US session, but it was surprisingly active for a holiday, likely influenced by the previous day’s disappointing ISM services report and anticipation of tomorrow’s employment data. Adding to the mix were political uncertainties surrounding the US, French, and UK elections, providing much for investors to consider. Consequently, US dollar selling kicked off early and continued throughout European trading, only tapering off as London markets closed.
During the day, several key levels were tested: GBP and AUD neared weekly highs, while USD/CAD hit its lowest point in a month, buoyed by strong oil prices. USD/JPY seemed to find some support from the slowing US economy, experiencing a one-cent drop after Wednesday’s weak ISM services data, with long positions potentially being covered ahead of the non-farm payrolls report. The pair ended the day down half a cent, a rare win for the bears.
Today’s Market Expectations
Today the main event will be the NFP, which will likely decide the fate of the USD for several sessions, into early next week. It is expected that the US Non-Farm Payrolls will show an addition of 180,000 jobs in June, a decrease from the 272,000 jobs added in May, with the unemployment rate remaining steady at 4.0%. The forecast for Average Hourly Earnings on a month-over-month basis is 0.3%, down from the previous 0.4%. The Federal Reserve is closely monitoring the labor market, as they foresee a significant downturn. Recall that the Fed projected an average unemployment rate of 4% for 2024. If unemployment rises to 4.2% in the coming months, it could prompt them to consider a rate cut. Currently, the data suggests a rebalancing in the labor market, with fewer hires than layoffs, but overall, there are no clear signs of a downturn.
It is anticipated that the Canadian labor market data will reveal an addition of 25,000 jobs in June, slightly down from the 26,700 jobs added in May, with the unemployment rate expected to rise to 6.3% from 6.2% in May. Despite another increase in the jobless rate, the most recent report was surprisingly positive. The Bank of Canada (BoC) is primarily focused on wage growth, which recently jumped to 5.1% from 4.7%. This is a crucial factor. Recall that last week’s unexpected increase in the Canadian CPI occurred even as underlying inflation indicators remained within the 1-3% target range. As a result, the market has reduced its expectations for a rate cut, with the likelihood now at 50%. Before the next BoC policy decision, another inflation report will be released. If wage growth jumps again, the central bank will likely need very favorable CPI figures to justify a rate cut in July.
Yesterday was quiet art first but volatility kicked in during the US session. The price action was mixed though, with risk assets being quiet early but reversing in the US session and sending stock markets higher. We opened 8 trading signals yesterday, ending the day with 7 closed trades, 5 of which were winning forex signals and two were losing signals.
Gold Stalls at the 50 Daily SMA Ahead of the NFP
Following the soft US economic data, gold prices rose on Wednesday, with XAU surging above the 50-day moving average, which had previously served as resistance and provided good selling opportunities. During the US session, the USD declined after lower-than-expected ADP payroll data and significantly weaker ISM non-manufacturing figures. This led to gold climbing $25.75, or 1.10%, to $2,354.87. However, yesterday, the gold price stalled at these levels, as buyers awaited the release of the NFP (Non-Farm Payroll) numbers to gauge the market’s direction.
XAU/USD – Daily chart
MAs Keeping USD/JPY Supported During Dips
USD/JPY has surged above the critical 160.00 barrier, driven by minimal intervention from Japanese authorities, which has bolstered market confidence in achieving new highs. Last week, the pair dipped to 160.00 but swiftly recovered as buyers stepped in around 160.20, solidifying this level as a robust support zone. On the 4-hour chart, a minor trendline has emerged, with the 20 SMA (gray) indicating notable buying pressure. However, the 20 SMA was breached yesterday following disappointing US ISM services data, indicating a contraction in the sector for June. This development caused a sharp 100-point decline, pushing the pair below 161. The descent found support just above the 50 SMA (yellow), signaling a bullish reversal. Buyers are expected to look to the 50 SMA to sustain upward momentum and aim for new highs. The recent bounce above the 50 SMA reinforces the positive outlook, suggesting readiness in the market to test higher levels.
USD/JPY – H4 Chart
Cryptocurrency Update
Bitcoin Breaks Below the 200 Daily SMA
Although Bitcoin had found solid support near the $60,000 zone for a while, it has recently taken a sharp turn downward. This week has seen a significant decrease in cryptocurrency values, with prices dropping below $60,000 yesterday and continuing to fall today, reaching the next crucial level from early May. There was a momentary dip below $57,000, which increased the likelihood of a more substantial break on the charts. The 200-day moving average (purple line), which held steady at $57,000 before being broken in May, has again come under threat. However, support at $58,000 held on the first attempt. A sustained decline below this mark, the first significant breach since October last year, would signal a shift toward bearish momentum for Bitcoin. Although buyers still hold some hope, with the May 1 low around $56,500 providing potential support, the breach of the 200-day moving average is likely to embolden sellers, leading to a more aggressive downward move. Consequently, this critical support may not hold for long.
BTC/USD – Daily chart
The 200 SMA Stops the Crash in Ethereum
Ethereum (ETH) has experienced notable volatility since the launch of its ETF, soaring to a peak of $3,832.50. This surge was driven by increased market confidence following the SEC’s favorable decision on spot Ethereum ETFs. ETH has risen by 25% from its previous peak, underscoring robust investor interest and market demand. However, Ethereum has recently slipped below the $3,500 mark. Last week, the 20-week Simple Moving Average (SMA) (represented by the gray line) provided crucial support, and this week, we are witnessing a rebound from that SMA. This suggests a potential stabilization and renewed upward momentum for Ethereum in the short term. However, prospective buyers of ETH will need to surpass the 20 SMA (gray line) to establish a sustainable upward trend.
ETH/USD – Daily chart


| Broker | Website | |
|---|---|---|
| 🥇 |  | Visit Broker |
| 🥈 | Visit Broker | |
| 🥉 | Visit Broker | |
| 4 |  | Visit Broker |
| 5 |  | Visit Broker |
| 6 |  | Visit Broker |
| 7 |  | Visit Broker |