


WTI Crude Oil Prices Dip from Two-Month Highs $84.35; What’s Next?
On Thursday, oil prices retreated from their two-month highs as traders took profits following a strong surge earlier in the week.
The decline was also influenced by weak U.S. economic data, raising concerns about long-term demand. As of 04:50 ET (08:50 GMT), Brent oil futures dropped 0.6% to $86.80 a barrel, while West Texas Intermediate (WTI) crude futures fell 0.7% to $83.30 a barrel. The downturn followed disappointing labor market and purchasing managers index (PMI) data, signaling a cooling U.S. economy, the world’s largest energy consumer.
US Inventories See Significant Drawdown
Despite the recent weakness, both Brent and WTI benchmarks are poised for their fourth consecutive weekly gain, supported by a larger-than-expected drawdown in U.S. oil inventories. Official data released on Wednesday revealed that U.S. oil stockpiles fell by just over 12 million barrels in the week ending June 28, far exceeding expectations of a 0.4 million barrel draw. Additionally, significant reductions in gasoline and distillate stocks indicated rising demand as the summer season progresses. The Independence Day holiday also contributed to this increase, with a record number of Americans traveling by road.
Geopolitical Risks and Supply Disruptions
Geopolitical tensions in the Middle East have maintained a risk premium in oil prices, particularly as conflicts between Israel and Lebanon’s Hezbollah remain unresolved. Moreover, potential disruptions in the Gulf of Mexico’s oil production added to supply concerns. Hurricane Beryl’s impact has already prompted companies like Shell, BP, and Exxon Mobil to evacuate some of their platforms in the region. According to the National Hurricane Center and the Bureau of Ocean Energy Management, about 73,000 barrels per day of federal offshore oil production lie within the projected path of the storm.
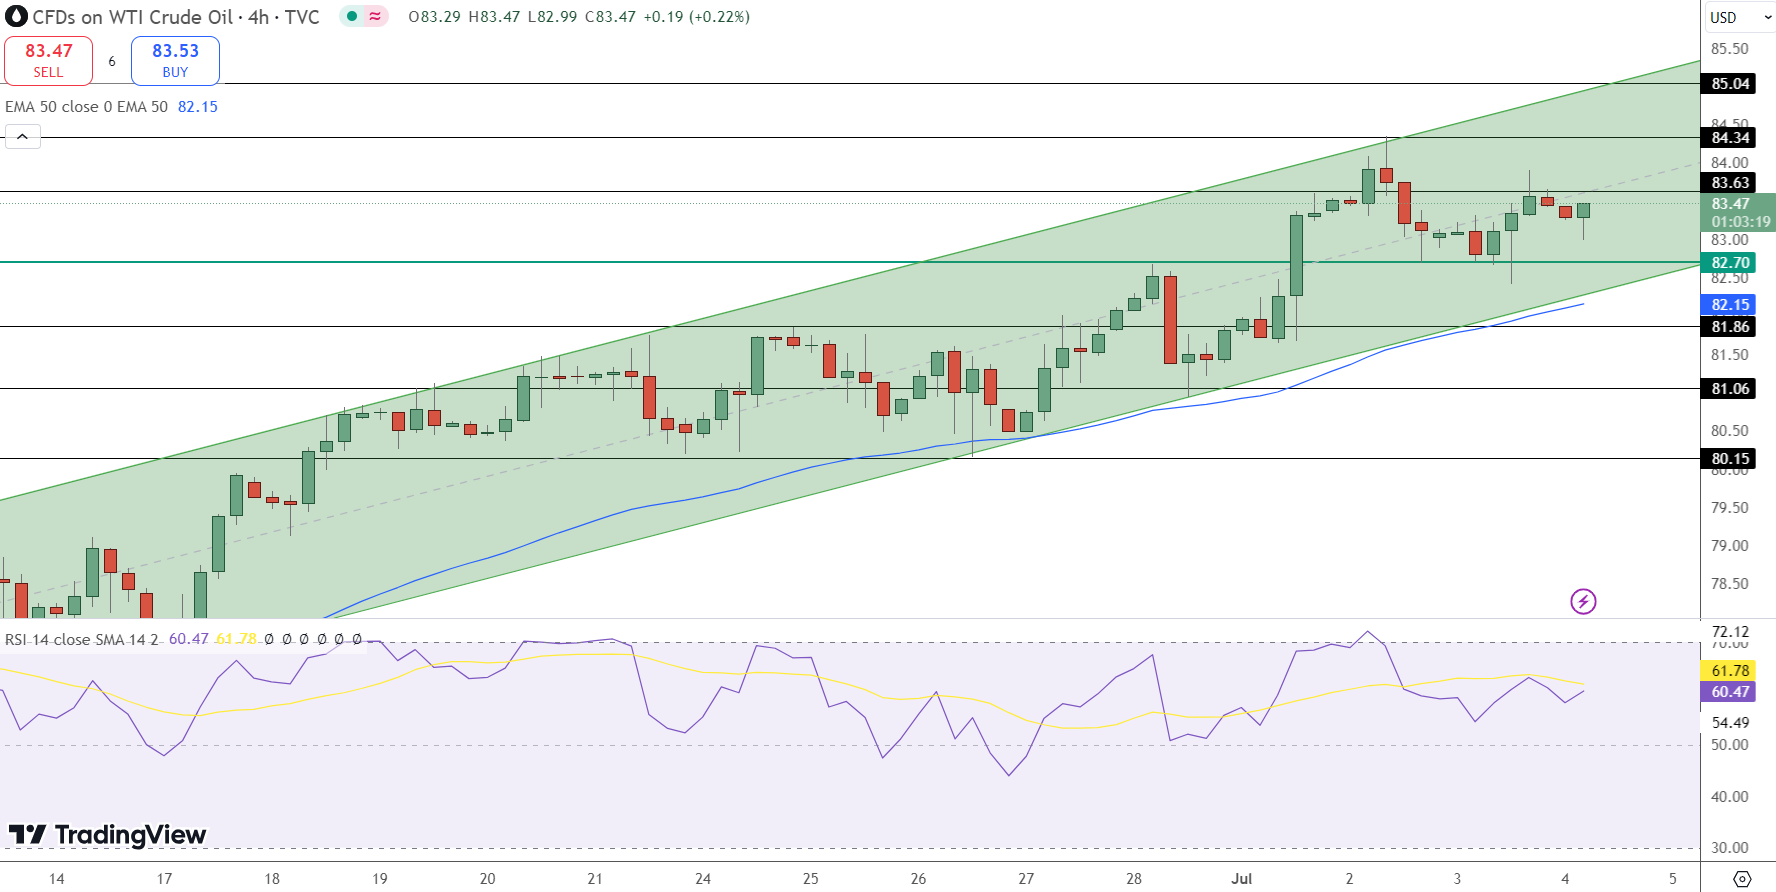
WTI Crude Oil Price Forecast
WTI crude oil is currently trading at $83.29, down 0.28%. The 2-hour chart identifies a pivot point at $83.12. Immediate resistance is at $83.75, with further resistance levels at $84.31 and $84.89. Support levels are marked at $82.40, $81.89, and $81.39. Technical indicators, including the 50 EMA at $82.80 and the 200 EMA at $80.93, suggest a bullish trend. WTI remains bullish above $83.12; however, a break below this level could trigger a sharp sell-off.
Quote: “Recent reports suggest that the hurricane is now disrupting US oil output, with companies like Shell, BP, and Exxon Mobil evacuating some of their platforms in the Gulf of Mexico,” noted analysts at ING.


🏆 7 Best Forex Brokers
| Broker | Website | |
|---|---|---|
| 🥇 |  | Visit Broker >> |
| 🥈 | Visit Broker >> | |
| 🥉 |  | Visit Broker >> |
| 4 |  | Visit Broker >> |
| 5 |  | Visit Broker >> |
| 6 |  | Visit Broker >> |
| 7 |  | Visit Broker >> |


