


Forex Signals July 3: Will US Jobs Report Show More Weakness?
Yesterday started with the CPI inflation report from the Eurozone, which showed that headline inflation ticked lower to 2.5%, approaching the 2% ECB target, however, core CPI remained stubbornly sticky at 2.9%. But that didn’t help the Euro or change the ECB stance as Christine Lagarde later confirmed.

During a panel discussion in Portugal, Fed Chair Jerome Powell and ECB President Christine Lagarde shared their views on policy and the economy. Powell indicated that while inflation is on a deflationary path, the labor market remains robust amidst ongoing rebalancing. He emphasized the need for continued efforts to manage inflation, pointing out that recent data, especially the latest PCE at 2.6%, indicates significant progress. Powell underscored the necessity of cautious action to avoid jeopardizing inflation improvements, mentioning that risks are becoming more balanced. He refrained from commenting on a potential rate cut in September.
The US JOLTs data for May exceeded expectations, with job openings rising to 8.140 million from 7.910 million. Despite this strength, the data is from May, and the longer-term trend has been downward over the past year. The ADP employment figures are set to be released tomorrow at 8:15 a.m. ET, with projections of 163K compared to last month’s 153K. Additionally, the BLS employment report, due on Friday, is anticipated to show 195K non-farm payroll jobs, down from 272K last month. The unemployment rate is expected to remain at 4.0%, with average hourly earnings projected to increase by 0.3%, slightly down from 0.4% last month.
Today’s Market Expectations
The upcoming US Jobless Claims and ADP report are set to provide further insights into the US labor market, which is showing signs of weakening. While Initial Claims remain at cycle lows, Continuing Claims have been steadily increasing, recently hitting a new cycle high. This trend is something worth monitoring closely. This week’s Initial Claims are projected to be 235K, slightly up from 233K the previous week. However, there is no consensus yet on the Continuing Claims forecast.
The US ISM Services PMI is forecasted to decline to 52.5, down from 53.8 in the previous period. This survey hasn’t been offering any clear signals recently. However, the S&P Global US PMIs previously surprised on the upside, with the Services indicator showing a notable increase. The employment sub-index will likely be a focal point ahead of the NFP report. So far, the data indicates that the US economy is performing well and the labor market remains resilient.
Yesterday the price action in markets was mixed, with risk sentiment being off in the first half but reversing in the US session and sending stock markets higher. We opened 10 trading signals yesterday, ending the day with 7 closed trades, 5 of which were winning forex signals and two were losing signals.
Gold Consolidating Below the 20 SMA
The gold price remains rangebound as the US dollar remains uncertain, with XAU bouncing between two moving averages that act as support and resistance, offering decent trading opportunities. During the Asian and European sessions today, gold (XAU/USD) attracted more sellers, bringing it closer to the critical 100-day Simple Moving Average (green), which has been providing support. As investors awaited further information on the Federal Reserve’s rate-cutting plans, the US dollar gained strength, exerting significant downward pressure on gold and driving it below $2,320 earlier today, leading us to close our sell gold signal. Although the price initially rebounded after the JOLTS data release, the 200-day SMA (red) served as resistance, rejecting the price and returning it to its previous range.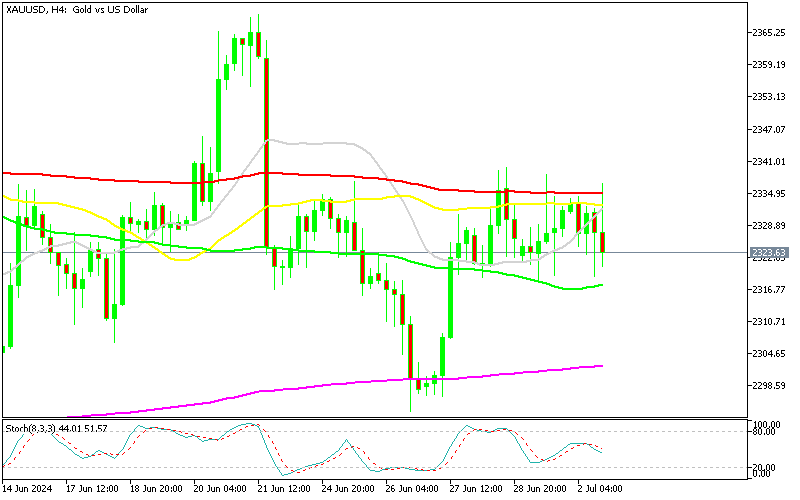
XAU/USD – Daily chart
MAS Turn Into Resistance for NZD/USD As Sellers Prevail
The NZD/USD pair has frequently bounced back from the consolidation zone near the critical support level of 0.61. Buyers have consistently stepped in at this point, pushing the price higher. However, market dynamics shifted last week as sellers took charge, pushing the market below this crucial level and breaking through the 0.61 mark. This shift has intensified bearish momentum, potentially paving the way for a decline towards the 0.60 zone.
NZD/USD – H4 Chart
Cryptocurrency Update
Bitcoin Finding Resistance at MAs
Bitcoin has been on a downward trend for the past two weeks, with prices now settling around $60,000. Yesterday, we issued a buy signal for Bitcoin with a target of $70,000, believing that the current support zone would hold. However, considering Bitcoin’s recent steep decline, holding a long position now entails significant risk, akin to catching a falling knife. Consequently, we are closely monitoring price movements for signs of a potential bottom formation. Following yesterday’s move above $60,000, our focus has shifted to maintaining our long position at this level. It’s important to note that the 200-day Simple Moving Average (SMA) in purple provided substantial support during Monday’s decline, helping Bitcoin stabilize. But the 20 SMA turned into resistance and pushed the price lower yesterday.
BTC/USD – Daily chart
The 20 SMA Stops Ethereum From Reversing Higher
Ethereum (ETH) has experienced significant volatility since the launch of its ETF, reaching a high of $3,832.50. This surge was driven by heightened market confidence following the SEC’s positive ruling on spot Ethereum ETFs. Ethereum’s value increased by 25% from previous highs, indicating strong investor interest and market demand. However, Ethereum recently fell below the $3,500 threshold. Last week, the 20-week Simple Moving Average (SMA) (gray line) acted as support, and this week we’re observing a rebound off that MA. This could suggest a potential stabilization and renewed upward momentum for Ethereum in the near term but firt, ETH buyers should break above the 20 SMA (gray).
ETH/USD – Weekly chart


🏆 7 Best Forex Brokers
| Broker | Website | |
|---|---|---|
| 🥇 |  | Visit Broker >> |
| 🥈 | Visit Broker >> | |
| 🥉 |  | Visit Broker >> |
| 4 |  | Visit Broker >> |
| 5 |  | Visit Broker >> |
| 6 |  | Visit Broker >> |
| 7 |  | Visit Broker >> |


