


Oil Prices Steady at $86.80 Amid Summer Travel Demand and Rate Cut Hopes
Oil prices held steady on Tuesday, lingering near the two-month highs seen in the prior session, buoyed by prospects of enhanced fuel demand from the summer travel surge and potential U.S. interest rate reductions to spur economic growth.
Demand Dynamics and Market Sentiments
“The market’s dynamics seem to be swayed more by sentiment and geopolitical fears rather than direct fundamentals,” commented Vandana Hari, the founder of Vanda Insights.
She cited the anticipated uptick in summer fuel demand, heightened tensions between Israel and Iran, and the looming threat of Hurricane Beryl as key factors underpinning oil prices. In the U.S.—the globe’s largest oil consumer—gasoline demand is expected to surge as the summer travel season accelerates, highlighted by the Independence Day holiday.
The American Automobile Association anticipates travel during this period to be 5.2% greater than last year, with car travel up by 4.8%.
Supply Concerns and Economic Indicators
On the supply side, the oil markets are bracing for possible disruptions from Hurricane Beryl, which has impacted Caribbean regions as a category 4 storm and is expected to affect oil production in Mexico’s Bay of Campeche. Meanwhile, recent economic reports suggesting a cooling of inflation in the U.S. have renewed optimism that the Federal Reserve might lower interest rates, potentially in September.
Such a move could invigorate economic activities and boost oil demand. However, weaker-than-expected demand growth, especially in Asia—the largest oil-consuming region—and reduced imports by China, the top oil importer, have tempered price gains.
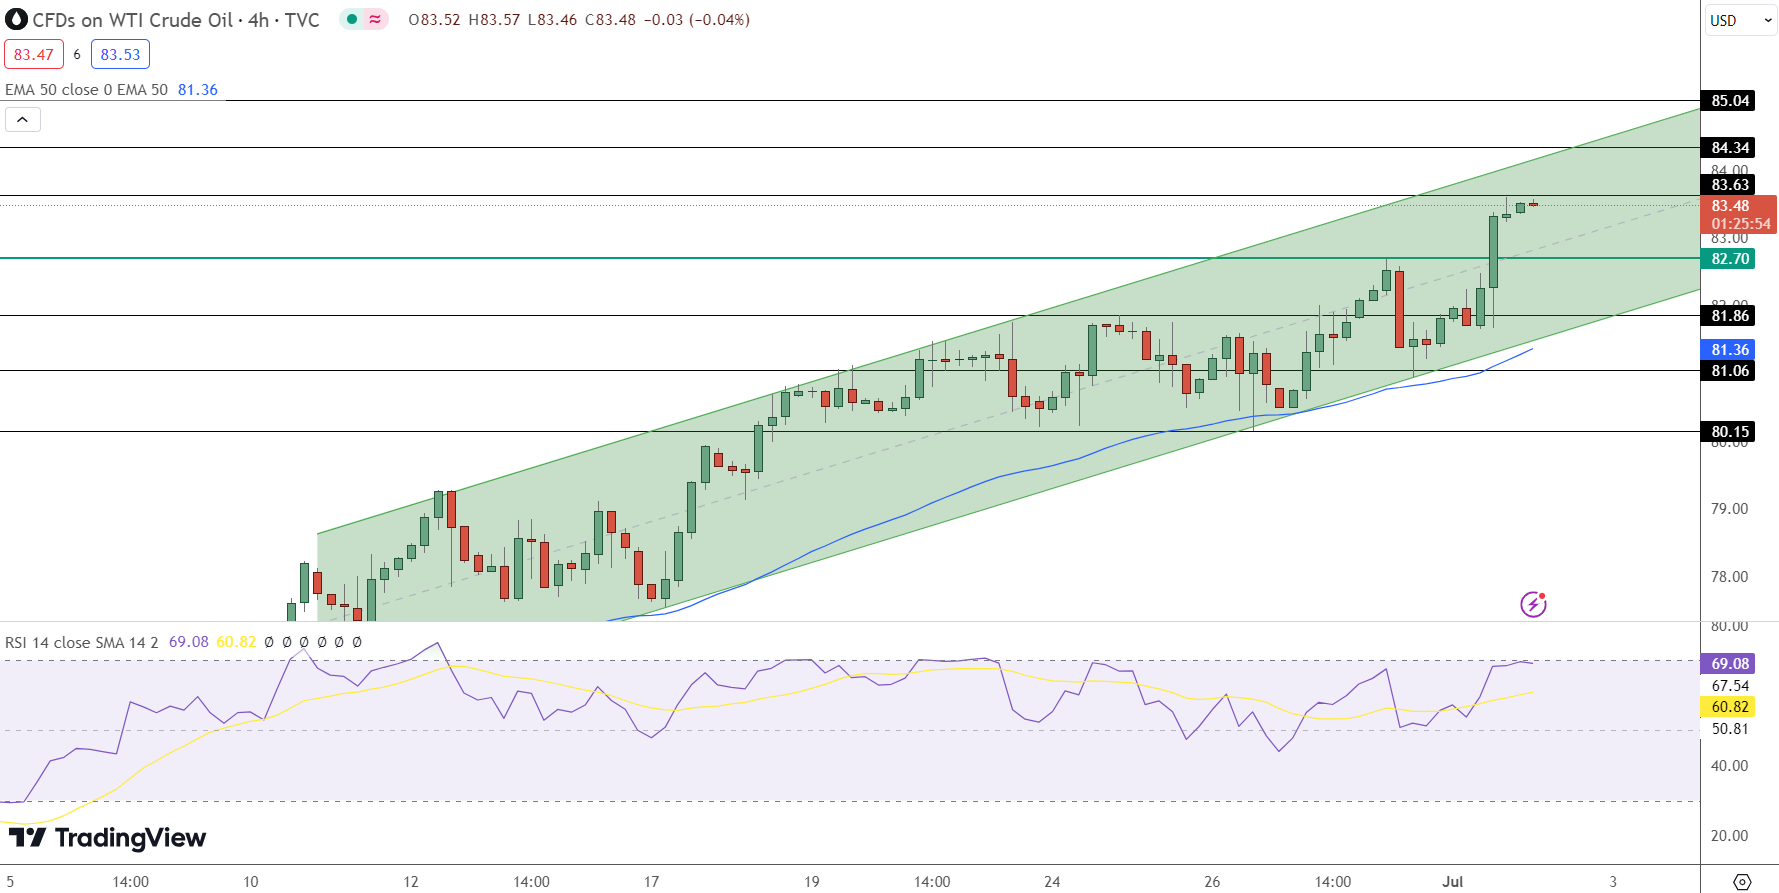
WTI Crude Oil Price Forecast
USOIL is currently trading at $83.48, marking a 0.17% increase. On the 4-hour chart, key price levels are critical for traders. The pivot point stands at $82.70. Immediate resistance is at $83.63, with further resistance levels at $84.34 and $85.04. On the downside, immediate support is at $81.86, followed by $81.06 and $80.15.
Technical indicators show the Relative Strength Index (RSI) at 69.00, suggesting strong bullish momentum. The 50-day Exponential Moving Average (EMA) is positioned at $81.36, providing near-term support.


🏆 7 Best Forex Brokers
| Broker | Website | |
|---|---|---|
| 🥇 |  | Visit Broker >> |
| 🥈 | Visit Broker >> | |
| 🥉 |  | Visit Broker >> |
| 4 |  | Visit Broker >> |
| 5 |  | Visit Broker >> |
| 6 |  | Visit Broker >> |
| 7 |  | Visit Broker >> |


