


Gold Price Hovers at $2,328 Amid Fed Rate Cut Speculation and Treasury Yields
Gold prices are hovering at $2,328 during the Asian session, driven by prevailing uncertainty over the US Federal Reserve’s next move on interest rates.
Recent data releases have given mixed signals, prompting expectations of a possible rate cut from the Fed in the September meeting. However, comments from various Fed officials are increasing uncertainty and causing a mixed market reaction.
The US dollar’s decline is influenced by cautious market sentiment and rising expectations of a rate cut in September. According to the CME FedWatch Tool, there is a 58% chance of a 25-basis-point rate cut in September. These expectations have kept the US dollar under pressure, contributing to the rise in gold prices.
On the Treasury yields front, the 10-year yields have risen by 1.67%, which has kept gold’s gains in check. San Francisco Fed President Mary Daly emphasized a cautious approach to controlling inflation, highlighting the risk of rising unemployment.
She stressed the importance of restoring price stability without causing economic disruption and noted that while more work is needed to lower inflation, the Fed must also be prepared for potential increases in unemployment if the labor market slows down.
Furthermore, Richmond Fed President Thomas Barkin, speaking at the Global Interdependence Center in Paris, advocated for a careful approach to monetary policy. He acknowledged the ongoing effects of policy adjustments and the potential for further economic slowdown, emphasizing the need for flexibility in responding to new economic data.
Barkin also noted the upward pressure on prices from the services and shelter sectors and suggested that recent rate hikes might not be as constraining on the economy as initially anticipated, given its current resilience. These comments from Fed officials have kept the market’s reaction in check on Monday.
Gold Price Forecast: Technical Outlook
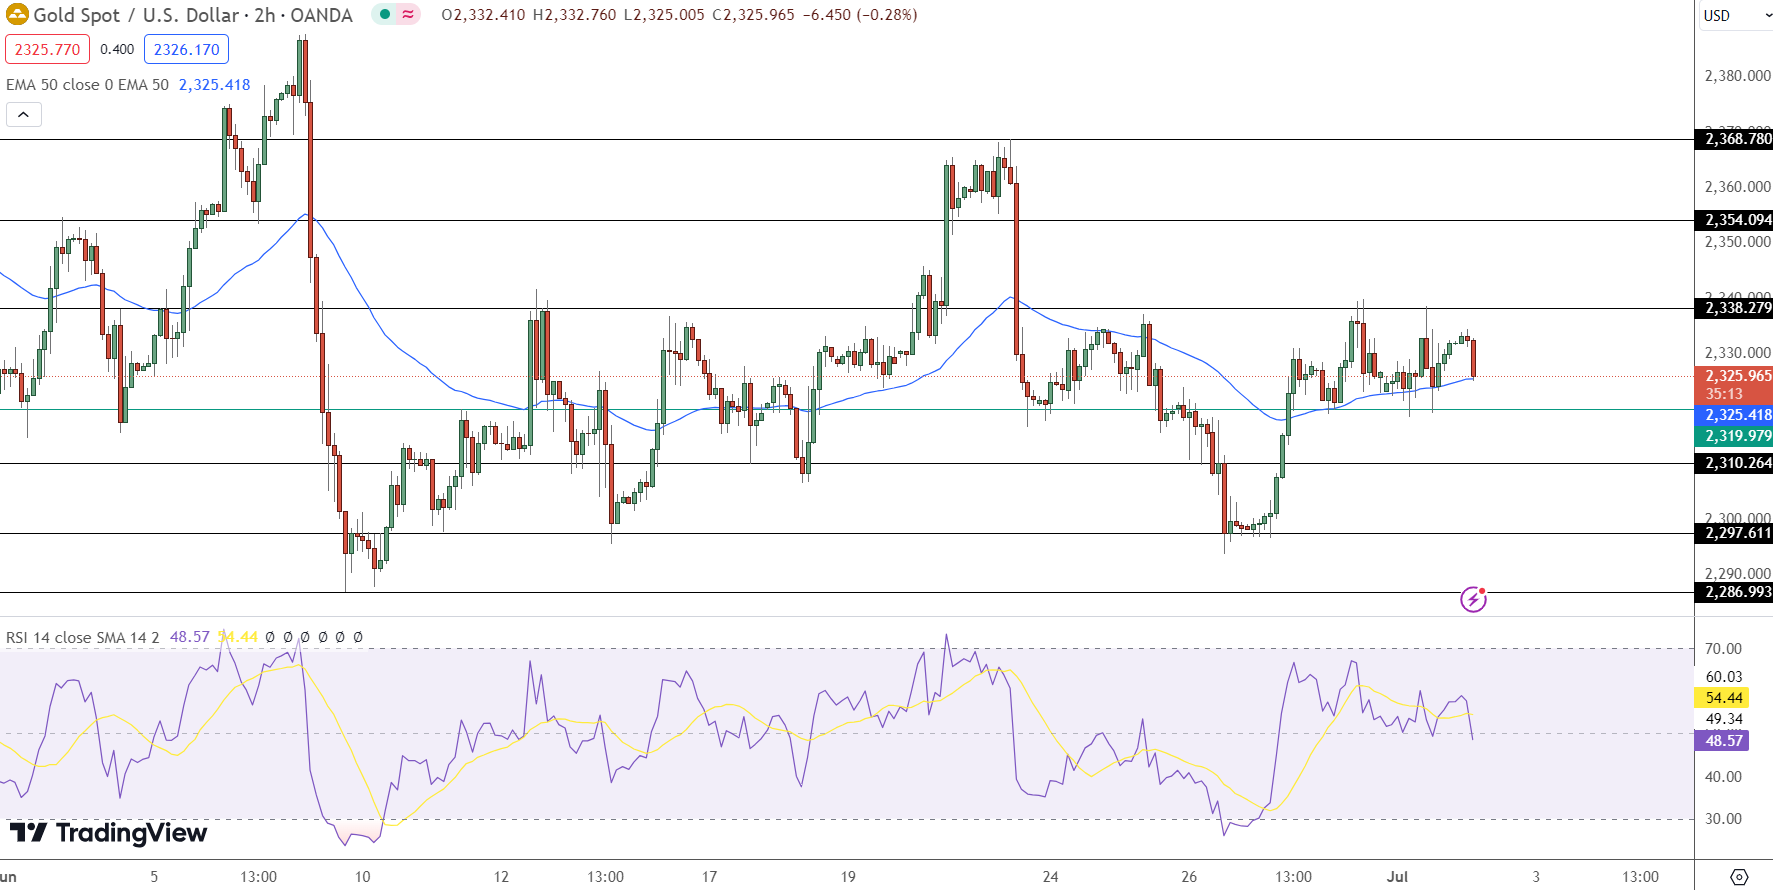
Gold is currently trading at $2,325.96, reflecting a 0.25% decline. The 4-hour chart highlights key price levels for traders to watch closely. The pivot point is set at $2,319.98, serving as a critical level for potential price movements.
Immediate resistance is identified at $2,338.28, followed by further resistance levels at $2,354.09 and $2,368.78. On the downside, immediate support is at $2,310.26, with additional support at $2,297.61 and $2,286.99.
Technical indicators show the Relative Strength Index (RSI) at 48, indicating neutral momentum. The 50-day Exponential Moving Average (EMA) is positioned at $2,325.42, providing near-term support. A notable technical pattern includes a triple top resistance near $2,338.


🏆 7 Best Forex Brokers
| Broker | Website | |
|---|---|---|
| 🥇 |  | Visit Broker >> |
| 🥈 | Visit Broker >> | |
| 🥉 |  | Visit Broker >> |
| 4 |  | Visit Broker >> |
| 5 |  | Visit Broker >> |
| 6 |  | Visit Broker >> |
| 7 |  | Visit Broker >> |


