


Forex Signals Brief July 2: EZ CPI Inflation Expected to Fall Again
The week started with the Manufacturing and Services PMI data from China which was released over the weekend and showed a slowdown. However, the Caixin manufacturing released early yesterday showed a slight improvement, which balanced the situation.

In the European session, we had the regional CPI inflation numbers from Germany, with the Federal CPI number coming at 0.1% month-on-month, which shows that inflation is falling in Europe, while the ECB confirmed two more rate cuts for this year. However, the Euro ended up higher at the end of the day, after the first round of general elections in France.
The USD rose yesterday, driven by a surge in rates that caused the yield curve to steepen once again, showing strength across the board as Treasury yields increased, although it lagged behind the EUR and GBP as the trading week began. The USD was particularly strong against the CHF, CAD, and JPY, with USD/JPY reaching a new high for the year and the highest level since January 1987, hitting 161.73. As long as the price stays above this 1990 high, buyers maintain control of the USD/JPY pair, paving the way for further gains.
Despite the rise in rates, the economic data was weaker than expected. Construction spending fell by 0.1%, compared to the predicted 0.2% increase. The ISM manufacturing index also came in lower than anticipated, at 48.5 points versus the expected 49.1 points. Additionally, the prices paid and employment components were weaker, adding to the mixed economic outlook.
This Week’s Market Expectations
The Eurozone CPI year-over-year is forecasted to be 2.5%, down slightly from 2.6% the previous year, while the Core CPI year-over-year is anticipated to be 2.8%, a decrease from 2.9%. This report is expected to have minimal impact on the ECB’s plans, as the bank aims to review the data over the summer before making a decision on potential interest rate cuts in September. However, if inflation subsides more rapidly this summer or if the economic situation worsens significantly, the market might start pricing in additional rate cuts before year-end. Currently, the market anticipates 46 basis points of easing by the end of the year, with a 61% chance of no change at the July meeting and an 83% likelihood of a rate cut in September.
US job openings are expected to decline to 7.850 million from the previous 8.059 million. The latest figures significantly missed projections, marking the lowest number of job vacancies since February 2021 and nearing pre-pandemic levels. This development is favorable for the Fed, as it indicates the labor market is rebalancing through a reduction in job openings rather than an increase in layoffs, which should help ease inflationary pressures. Nonetheless, the labor market needs to be closely observed at this stage of the economic cycle.
We will also hear from Fed Chair Powell, who is set to speak at the European Central Bank Forum on Central Banking 2024 in Sintra, Portugal. I don’t expect him to convey any new information and anticipate he will maintain his usual neutral stance.
Yesterday the volatility was low during the Asian and European sessions, however there was a spike and a reversal in most pairs after the weak US ISM manufacturing report. We opened 8 trading signals in total, however, only five signals closed, and we ended up with three winning forex signals and two losing signals.
Gold Consolidating Below the 20 SMA
In recent months, gold has consistently formed lower highs, with moving averages acting as resistance, indicating a potential trend reversal. However, the support level must be broken first. On Thursday, gold prices saw a modest recovery as the US dollar weakened. Despite this, GOLD lagged behind other assets, including foreign currencies, which experienced significant gains against the dollar as investors awaited the release of high US PCE inflation data. The data came out as expected, leaving gold unchanged by the end of the day.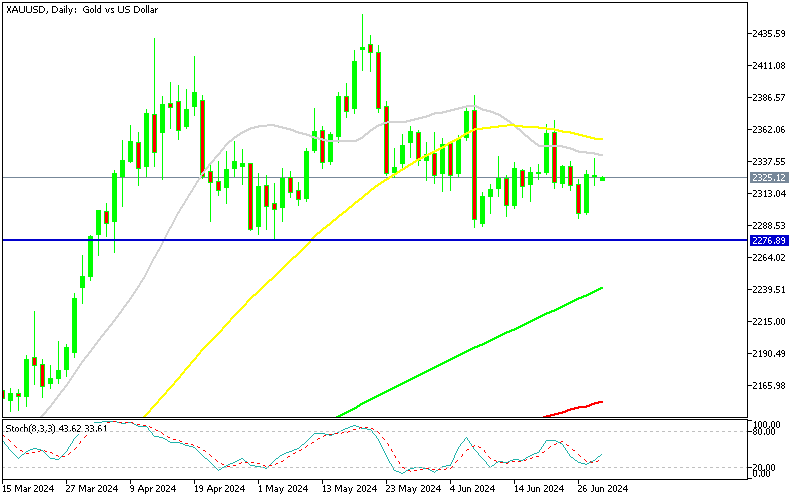
XAU/USD – Daily chart
AUD/USD Continues to Remain in Range
For the past two months, the AUD/USD rate has been confined within a narrow 100-pip range, with moving averages serving as key support and resistance levels. These technical indicators often provide traders with clear signals to enter the market, enabling them to capitalize on price rebounds at either end of the range. Yesterday, we saw another upward move prompted by weaker ISM manufacturing data from the United States, but the 200 SMA (purple) once again rejected the price, maintaining the established range.
AUD/USD – Daily Chart
Cryptocurrency Update
Bitcoin Pushes Higher After the Retreat Ended
BITCOIN has seen a downward trajectory over the past two weeks, with prices recently stabilizing around $60,000. Yesterday, we issued a buy signal for Bitcoin, setting a target of $70,000, confident that the current support zone would hold. However, given Bitcoin’s recent sharp decline, taking a long position now carries substantial risk, akin to catching a falling knife. Consequently, we are closely monitoring price movements for signs of a potential bottom formation. Following yesterday’s breakthrough above the $60,000 mark, our focus has shifted to maintaining our long position at this level. It’s noteworthy that the 200-day Simple Moving Average (SMA) in purple provided strong support during Monday’s decline, helping BTC to stabilize.
BTC/USD – Daily chart
Will Ethereum Bounce Off the 20 SMA?
Ethereum (ETH) has experienced considerable volatility since the introduction of its ETF, reaching a peak of $3,832.50. This surge was driven by heightened market confidence following a positive SEC decision on spot ETHEREUM ETFs. Ethereum’s value surged by 25% above its previous highs, indicating robust investor interest and market demand. However, Ethereum has recently dropped below the $3,500 mark. Last week, the 20 weekly Simple Moving Average (gray line) acted as support and this week we’re starting to see a bounce off that MA.
ETH/USD – Weekly chart


🏆 7 Best Forex Brokers
| Broker | Website | |
|---|---|---|
| 🥇 |  | Visit Broker >> |
| 🥈 | Visit Broker >> | |
| 🥉 |  | Visit Broker >> |
| 4 |  | Visit Broker >> |
| 5 |  | Visit Broker >> |
| 6 |  | Visit Broker >> |
| 7 |  | Visit Broker >> |


