


The 20 Daily SMA Supports USDJPY Uptrend, Holding Above 160
The USD/JPY uptrend continues, with the price holding above 160 and consolidating after breaching 161 last Friday. Despite this, the likelihood of the Bank of Japan (BOJ) intervening in the foreign exchange markets remains high. They previously intervened around the 160 level in April but are currently staying on the sidelines, even as the price has surpassed the April highs.
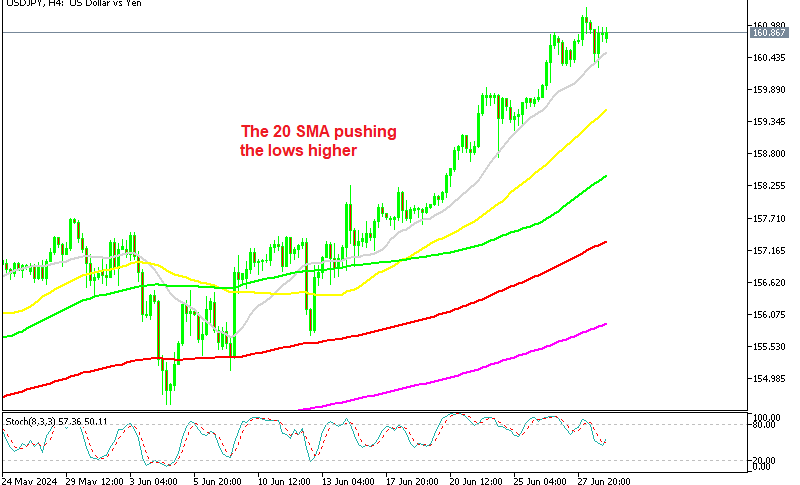
USD/JPY Chart Daily – The 20 SMA Is Supporting the Bullish Trend

The Tokyo core CPI inflation rate rose again in June, increasing from 1.9% to 2.1%, surpassing the forecast of 2.0%. Despite this rise, there was minimal reaction from the JPY, and the BOJ provided no signals of altering its monetary policy stance. The US dollar on the other hand, continues to receive support from mostly positive economic data, highlighted by last Friday’s US manufacturing and services PMI numbers and the recent US Consumer Confidence report.
Additionally, the US Unemployment Claims figures indicated a rebalancing labor market, characterized by fewer available jobs rather than increased layoffs. This ongoing positive economic data should maintain the bullish momentum in USD/JPY , keeping buyers in control.
USD/JPY Analysis Technical
On the daily chart, USD/JPY has successfully broken above the significant 160.00 threshold, pushing higher as the absence of intervention by Japanese Authorities has boosted market confidence to target new highs. There was a pullback to the 160.00 level last week, but the price bounced as buyers re-entered around 160.20s, aiming for further highs, with stops below this major.
On the 4-hour chart, a minor trendline has recently formed, marked by the 20 SMA (gray), indicating strong buying pressure. Buyers will depend on the 20 SMA to sustain the momentum towards new highs, while sellers will need to see the price dip below both the trendline and the 160.00 level to start aiming for new lows.
Japanese Tankan Manufacturing and Services for Q2
- BoJ Q2 Tankan large manufacturing index came at +13 points vs 12 points expected,
- Q1 Tankan large manufacturing index was 11
- This is published quarterly by the BOJ and is a closely watched economic indicator
- January-March Real GDP Annualized: Revised to -2.9% from a previously revised -1.8%. This indicates a sharper contraction than previously estimated, reflecting economic weakness during the first quarter of the year.
- October-December 2023 Real GDP: Revised to +0.1% annualized from +0.4% previously. This adjustment shows a slightly weaker growth rate than initially reported for the end of 2023.
- July-September 2023 Real GDP: Revised to -4.0% annualized from -3.7%. This revision indicates a deeper contraction during the third quarter of 2023, suggesting significant economic challenges during that period.
USD/JPY Live Chart


🏆 7 Best Forex Brokers
| Broker | Website | |
|---|---|---|
| 🥇 |  | Visit Broker >> |
| 🥈 | Visit Broker >> | |
| 🥉 |  | Visit Broker >> |
| 4 |  | Visit Broker >> |
| 5 |  | Visit Broker >> |
| 6 |  | Visit Broker >> |
| 7 |  | Visit Broker >> |


