


Forex Signals Brief June 28: All Attention Is on the PCE Prices!
Yesterday during the US session, there was a simultaneous release of several US economic data points, creating a challenging environment to decipher. The dollar initially declined by 20 pips amidst mixed news, with attention drawn to higher continuing claims and lower core durable goods orders, but then turned higher after the higher GDP and the prices index.

| Broker | Review | Regulators | Min Deposit | Website | |
|---|---|---|---|---|---|
| 🥇 |  |
Read Review | ASIC, FSA, CBI, BVI, FSCA, FRSA, CySEC, ISA, JFSA | USD 100 | Visit Broker >> |
| 🥈 | Read Review | FMA, FSA | USD 50 | Visit Broker >> | |
| 🥉 |  |
Read Review | FSCA, CySEC, DFSA, FSA, CMA | USD 0 | Visit Broker >> |
| 4 |  |
Read Review | ASIC, BaFin, CMA, CySEC, DFSA, FCA, SCB | USD 200 | Visit Broker >> |
| 5 |  |
Read Review | FCA, CySEC, FSCA, SCB | USD 100 | Visit Broker >> |
| 6 |  |
Read Review | FCA, FINMA, FSA, ASIC | USD 0 | Visit Broker >> |
| 7 |  |
Read Review | CySEC, FCA, FSA, FSCA, Labuan FSA | USD 100 | Visit Broker >> |
| 8 |  |
Read Review | CBCS, CySEC, FCA, FSA, FSC, FSCA, CMA | USD 10 | Visit Broker >> |
| 9 |  |
Read Review | ASIC, CySEC, FSCA, CMA | USD 100 | Visit Broker >> |
| 10 |  |
Read Review | IFSC, FSCA, ASIC, CySEC | USD 1 | Visit Broker >> |
Weak trade balance figures also cast a shadow on GDP forecasts, particularly impacting the Atlanta Fed tracker. However, the dollar swiftly rebounded from its initial dip and traded sideways thereafter, supported by slightly lower Treasury rates and a robust auction. Despite these movements, currency pairs in US trade generally maintained stability.
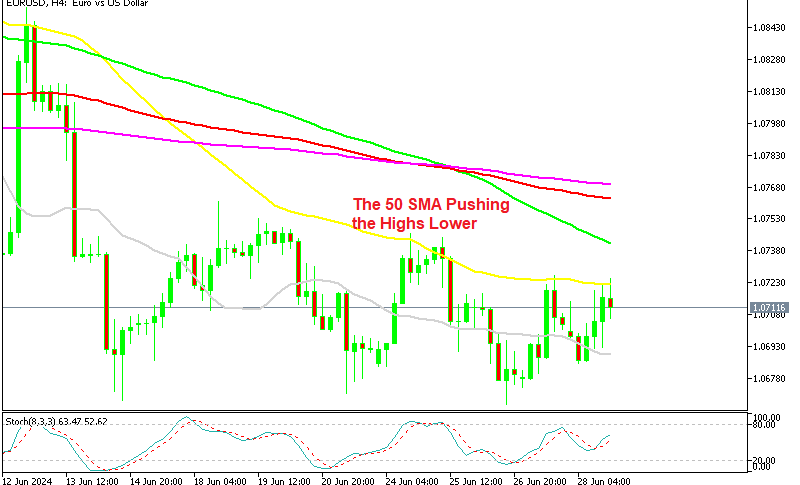
EUR/USD was moving higher early in the day, peaking at 1.0725 before retracing back and closing around the 1.07 level. The Australian dollar (AUD) remained unchanged for the third consecutive day amid deliberations over a potential rate hike amidst a global economic slowdown. Attention remained focused on USD/JPY again, influenced by concerns in Asia. Buyers entered later in the session, resulting in a relatively flat close. However, the pair failed to surpass its previous day’s peak.
Today’s Market Expectations
Today started with the Tokyo core CPI inflation which was released last night. Japan’s Tokyo Core CPI year-on-year came in at 2.1%, slightly exceeding expectations of 2.0%. This figure is particularly significant as Tokyo’s CPI often foreshadows trends in the national core CPI, which will be released later. Given that Tokyo’s data is published well ahead of the national figures, today’s June data provides valuable insights into potential inflationary pressures for the broader economy. Additionally, the jobs/applications ratio at 1.24 fell short of the expected 1.26, indicating a slightly weaker labor market than anticipated. Meanwhile, the unemployment rate remained unchanged at 2.6%, in line with expectations. These metrics collectively provide a snapshot of Japan’s economic health, influencing market sentiment and policy decisions moving forward.
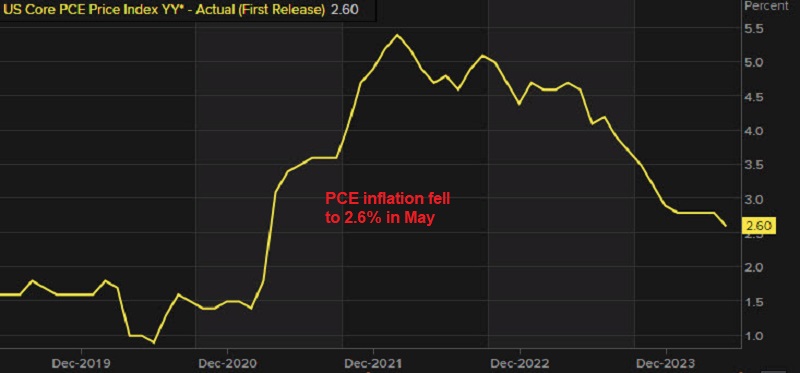
Later in the US session we have the major event of the week. forecast for US headline PCE year-over-year (Y/Y) stands at 2.6%, down from 2.7% the previous year, while the month-over-month (M/M) measure is expected to remain unchanged at 0.0%, compared to 0.3% previously. Core PCE Y/Y is anticipated to be 2.6%, down from 2.8% last year, with the M/M reading projected at 0.1%, down from 0.2% previously. With CPI and PPI data already released, forecasters have a good handle on the PCE outlook, minimizing its potential impact on the Fed’s cautious approach until at least September.
Yesterday the volatility was was normal, with the USD making a comeback after Thursday’s decline. We opened many trading signals, but four of them closed during the day, so we ended up with three winning forex signals and a losing one. Bitcoin was stabilizing above $61K, which is a good sign that the decline might be over and our signal which we opened above $60,000 is looking good.
Gold Makes A Comeback
Over the past couple of months, gold has been establishing progressively lower peaks, finding support around $2,270, suggesting a potential decline towards $2,180 if this support is breached. Last Friday, buyers attempted to push prices above the monthly high but fell short. Subsequently, on the same day, sellers reemerged, driving prices down by $50 to $2,316. Monday saw a modest recovery in gold prices amid a weaker US dollar, although it lagged behind other assets like foreign currencies, which saw substantial gains against the dollar. However, selling pressure persisted on Wednesday, pushing gold prices back to previous levels and settling below $2,300, but yesterday XAU jumped $35 higher, as investors braced themselves ahead of the upcoming strong US PCE inflation data release.
XAU/USD – Daily chart
USD/JPY Stabilizes Above 160
The purchasing pressure on USD/JPY has been notably strong. Following Japanese authorities’ intervention in late April, the pair experienced an approximate 8-cent decline. However, the 50-day Simple Moving Average (SMA) in yellow provided significant support in late May and early June, facilitating a rapid rebound in prices. This week, USD/JPY surged above 161, surpassing the previous intervention peak of 160.20. It’s important to recognize that while intervention can potentially slow the pace of depreciation, it typically does not reverse the underlying trend. Last night’s release of the Tokyo core CPI for June showed an increase from 1.9% to 2.1%, exceeding expectations of 2.0%. Despite this inflation uptick, there was no noticeable immediate reaction in the JPY markets.
USD/JPY – Daily Chart
Cryptocurrency Update
Bitcoin Consolidating Above $60,o00
Bitcoin has experienced a downward trajectory over the past approximately two weeks, maintaining a price around $60,000 recently. Yesterday, we opted to issue a buy signal for BTC with a target set at $70,000, confident that the current support zone would hold. However, given Bitcoin’s recent rapid decline, entering a long position now carries considerable risk, akin to catching a falling knife. Consequently, we are closely monitoring price movements to identify signs of a potential bottom formation. Following yesterday’s breach of the $60,000 barrier, our attention has shifted to our long position here. Notably, the 200-day Simple Moving Average (SMA) in purple proved resilient during Monday’s downturn, contributing to BTC’s stabilization.
BTC/USD – Daily chart
Ethereum Slips Below $3,400
Since its ETF launch, Ethereum (ETH) has exhibited significant volatility, reaching a peak of $3,832.50. This surge was driven by heightened market confidence following a positive SEC ruling on spot Ethereum ETFs. Ethereum’s value surged 25% above previous highs, underscoring robust investor interest and market demand. However, Ethereum recently dipped below $3,500. Over the weekend, the 50-day Simple Moving Average (yellow line), previously a supportive indicator, showed signs of weakening. On Monday, intensified selling pressure pushed the price below the 100-day SMA (green line), but it quickly rebounded.
ETH/USD – Daily chart


🏆 7 Best Forex Brokers
| Broker | Website | |
|---|---|---|
| 🥇 | | Visit Broker >> |
| 🥈 | Visit Broker >> | |
| 🥉 | | Visit Broker >> |
| 4 | | Visit Broker >> |
| 5 | | Visit Broker >> |
| 6 | | Visit Broker >> |
| 7 | | Visit Broker >> |


