EUR/USD In a Range Ahead of U.S. PCE Data

The market is awaiting PCE data from the U.S. later this afternoon, with analyst expecting the number to show a small decline.
Market sentiment has been mixed over the past weeks as hawkish and dovish sentiment battle to take the EUR/USD into the next direction. Yesterday’s data for Durable Goods was better than expected, but GDP growth was lower than the forecast from last month.
| Broker | Review | Regulators | Min Deposit | Website | |
|---|---|---|---|---|---|
| 🥇 |  |
Read Review | ASIC, FSA, CBI, BVI, FSCA, FRSA, CySEC, ISA, JFSA | USD 100 | Visit Broker >> |
| 🥈 | Read Review | FMA, FSA | USD 50 | Visit Broker >> | |
| 🥉 |  |
Read Review | FSCA, CySEC, DFSA, FSA, CMA | USD 0 | Visit Broker >> |
| 4 |  |
Read Review | ASIC, BaFin, CMA, CySEC, DFSA, FCA, SCB | USD 200 | Visit Broker >> |
| 5 |  |
Read Review | FCA, CySEC, FSCA, SCB | USD 100 | Visit Broker >> |
| 6 |  |
Read Review | FCA, FINMA, FSA, ASIC | USD 0 | Visit Broker >> |
| 7 |  |
Read Review | CySEC, FCA, FSA, FSCA, Labuan FSA | USD 100 | Visit Broker >> |
| 8 |  |
Read Review | CBCS, CySEC, FCA, FSA, FSC, FSCA, CMA | USD 10 | Visit Broker >> |
| 9 |  |
Read Review | ASIC, CySEC, FSCA, CMA | USD 100 | Visit Broker >> |
| 10 |  |
Read Review | IFSC, FSCA, ASIC, CySEC | USD 1 | Visit Broker >> |
The dollar lost some ground yesterday due to the weaker economic expansion expressed by the GDP Growth rate declining to 1.4% Q1 2024 from 3.4% Q4 2023. The market’s attention has now turned to the PCE MoM and YoY data for this afternoon.
It would surprise me that the PCE data is lower than the previous month’s number. The reason being that inflation data released yesterday was higher than expected and higher than the previous month’s.
Along with the main data yesterday, we also got GDP Price index, up 3.1% compared to last month’s 1.7%. We also got Core PCE Prices QoQ Final Q1, up 3.7% compared to last month’s 2%.
While the broader PCE Prices QoQ Final Q1 was also up 3.4% compared to last month’s 1.8%. Intuitively, I would mark today’s data to print higher than expected and higher than last month’s reading.
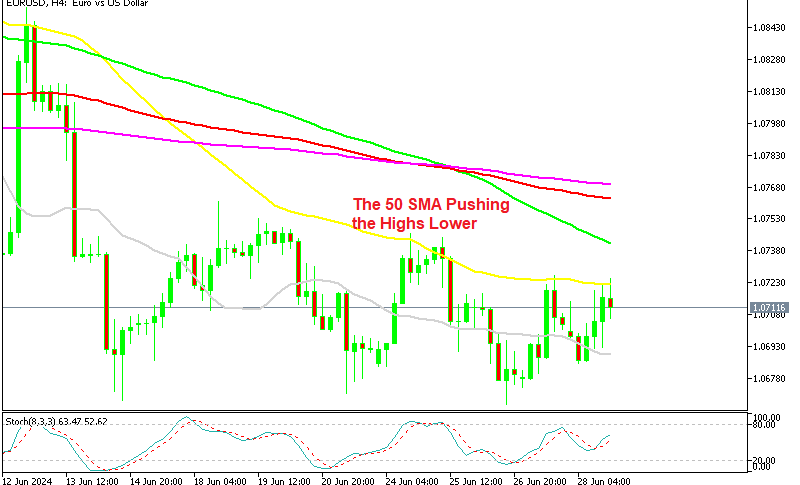
Technical View
The day chart below shows a EUR/USD price in a bearish market. Several candles below the cloud, and all components of the Ichimoku system aligned as bearish. However, looking at the chart we can also see the market is still with a range, even if that range is declining slightly.
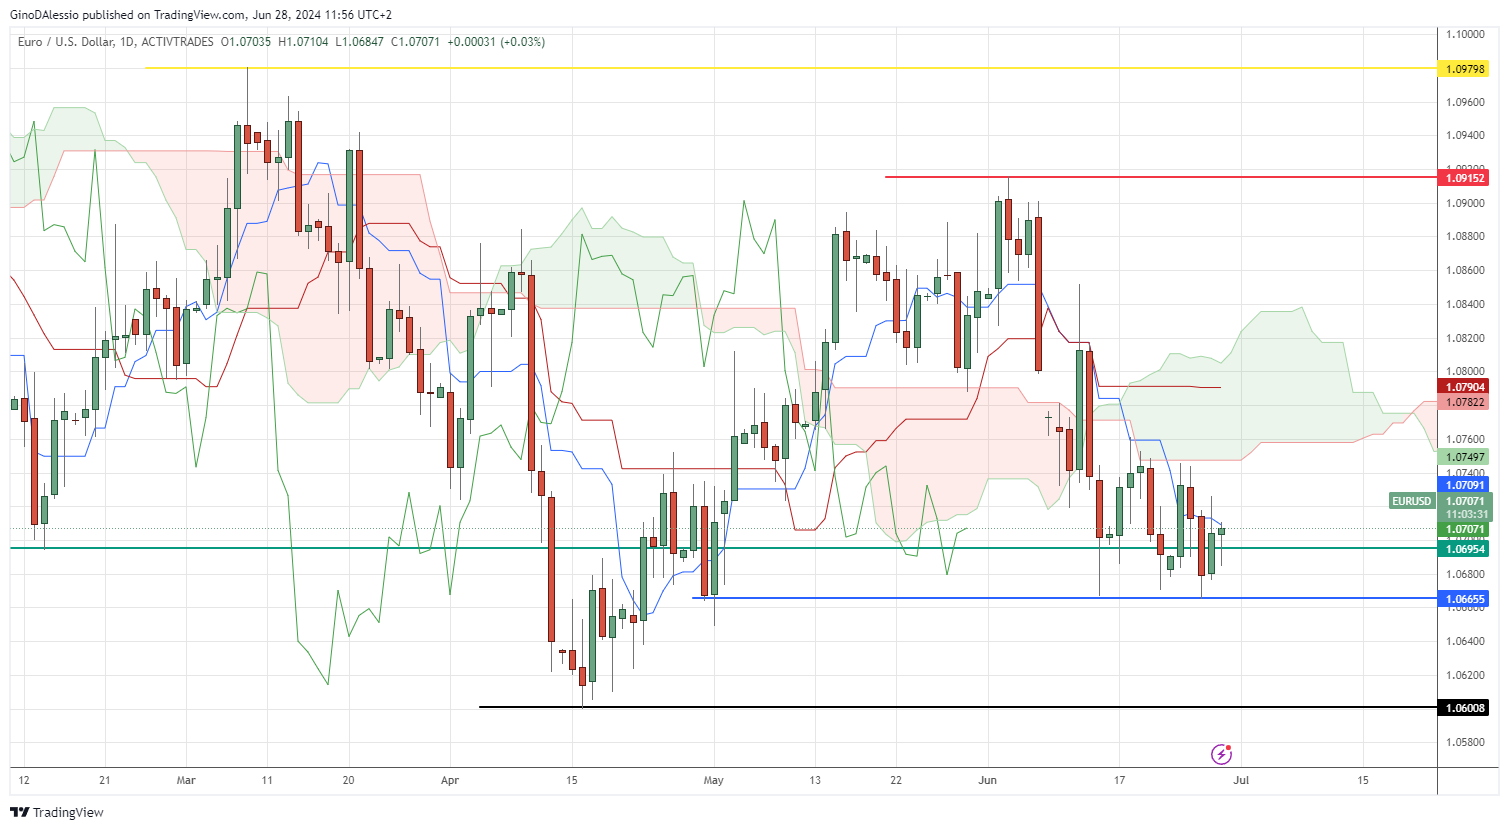
Since breaking below the cloud, the market has found support at 1.0665 (blue line). The nearest resistance is at the bottom of the cloud around 1.0749.
While the following support below 1.0665 is at 1.0600 (black line). That level coincides with the last dip on April 16 and with the support of the big figure of 06.