


Forex Signals Brief June 27: A Round of US Data Ahead of the PCE
The day started with Australian inflation data highlighting a key market theme: persistent inflationary pressures. This led to a drop in bond prices as higher interest rate expectations bolstered the US dollar and prompted some risk aversion in equities. The US dollar exhibited broad strength, particularly against the yen.

| Broker | Review | Regulators | Min Deposit | Website | |
|---|---|---|---|---|---|
| 🥇 |  |
Read Review | ASIC, FSA, CBI, BVI, FSCA, FRSA, CySEC, ISA, JFSA | USD 100 | Visit Broker >> |
| 🥈 | Read Review | FMA, FSA | USD 50 | Visit Broker >> | |
| 🥉 |  |
Read Review | FSCA, CySEC, DFSA, FSA, CMA | USD 0 | Visit Broker >> |
| 4 |  |
Read Review | ASIC, BaFin, CMA, CySEC, DFSA, FCA, SCB | USD 200 | Visit Broker >> |
| 5 |  |
Read Review | FCA, CySEC, FSCA, SCB | USD 100 | Visit Broker >> |
| 6 |  |
Read Review | FCA, FINMA, FSA, ASIC | USD 0 | Visit Broker >> |
| 7 |  |
Read Review | CySEC, FCA, FSA, FSCA, Labuan FSA | USD 100 | Visit Broker >> |
| 8 |  |
Read Review | CBCS, CySEC, FCA, FSA, FSC, FSCA, CMA | USD 10 | Visit Broker >> |
| 9 |  |
Read Review | ASIC, CySEC, FSCA, CMA | USD 100 | Visit Broker >> |
| 10 |  |
Read Review | IFSC, FSCA, ASIC, CySEC | USD 1 | Visit Broker >> |
Despite the verbal intervention from Japanese officials to curb the USD/JPY rise above 160.00, he clarified that there were no specific levels being monitored. This ambiguity was interpreted by some market participants as a green light to push the pair to 160.82, marking a gain of over 100 pips for the day.
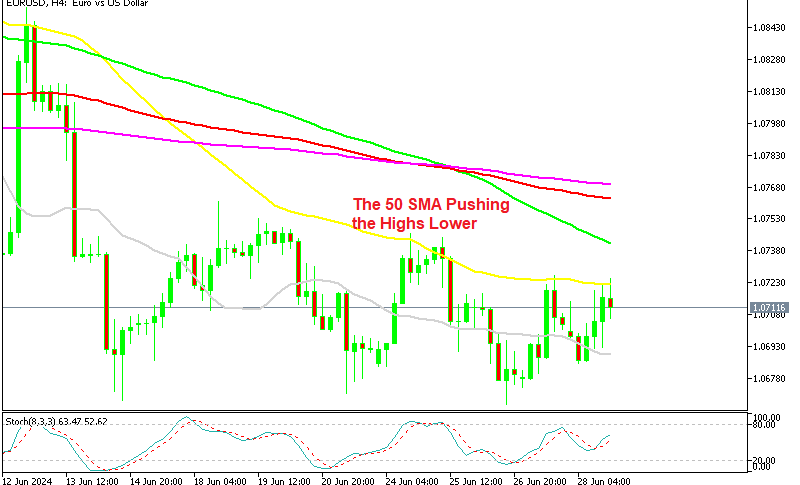
The yen wasn’t the only currency to weaken; the NZD fell to a six-week low, and the euro also faced selling pressure, contributing to overall US dollar strength. The question remains whether quarter-end dynamics are influencing these moves or if there are underlying fundamental reasons at play.
Today’s Market Expectations
The US Jobless Claims will be released later. Initial Claims have been hovering near their lowest points in the economic cycle, while Continuing Claims have shown stability around the 1800K mark. As market participants have grown accustomed to these figures, their impact has diminished somewhat. However, recent data has consistently fallen short of expectations, although it remains below peak levels observed earlier in the economic cycle. This trend merits close attention. For the upcoming week, Initial Claims are anticipated to decline to 236K, a slight drop from the previous week’s 238K, while Continuing Claims are expected to decrease to 1820K from 1828K the week prior.
Today we have the initial debate between President Biden and former President Trump is scheduled as the first of at least two debates preceding the November 5th election. This 90-minute discussion will occur in Georgia and is set to broadcast live on CNN at 9:00 PM EST on Thursday, June 27th.
The US Durable Goods Orders will also be released at the same time, with the headline number expected to show a decline at 0.5% for May, while the April number was revised lower. However, the Core Durable Goods Orders number is expected to show an increase of 0.2%.
Yesterday the volatility was low again, with the USD making a comeback after Monday’s decline. Bitcoin was volatile again, falling below $60,000 and bouncing above. We opened 7trading signals in total, with 6 forex signals closing at he end of the day. We ended up with three winning trades and three losing ones, however one of the winning Gold signals was a long term trade.
Gold After the Strong Rejection Last Week
Over the past two months, gold has been forming lower highs, with a support zone around $2,270 indicating a potential decline to $2,180 if this level is breached. Early last Friday, buyers attempted to push the price above the monthly high but were unsuccessful. Later that day, sellers reemerged, driving the price down by $50 to $2,316. On Monday, gold prices regained some ground as the US dollar weakened, though they lagged behind other assets, such as major currencies, which posted substantial gains against the dollar. However, selling pressure resumed yesterday, pushing gold prices back to their previous levels and closing below $2,300, fearing a high US PCE inflation number tomorrow.
XAU/USD – Daily chart
NZD/USD Breaks Below 0.61
The New Zealand dollar has been under continuous pressure, primarily due to periodic risk-off sentiment, which poses long-term challenges for the Kiwi. A close examination of the daily chart reveals that the NZD/USD pair has repeatedly bounced off the consolidation zone near the crucial support level of 0.61. Buyers have consistently stepped in around this area, pushing the price higher. However, sellers gained the upper hand yesterday, driving the market below this critical level and breaking through the 0.61 mark. This action has strengthened bearish momentum and set the stage for a potential slide to the 0.60 handle next.
NZD/USD – Daily Chart
Cryptocurrency Update
Buying Bitcoin Closer to $60,o00
Bitcoin has been on a downward trend for about two weeks, with the price hovering around $60,000 in the last few days. We decided to open a buy BTC signal yesterday, targeting $70,000, as it seems like this support zone is holding. With today’s rapid decline, entering the Bitcoin market on the long side seems risky, akin to catching a falling knife. Consequently, we are closely monitoring price movements for signs of a bottom formation. The $60,000 level was broken yesterday, so we shifted our focus to the early May low of $57,000 as a potential entry point for long positions. However, the 200 SMA (purple) held firm against the decline on Monday, and BTC rebounded higher.
BTC/USD – Daily chart
Ethereum Slips Below $3,400
Since the launch of its ETF, Ethereum (ETH) has experienced significant volatility, peaking at $3,832.50. This surge was driven by increased market confidence following a favorable SEC decision on spot Ethereum ETFs. Ethereum’s price climbed 25% from its previous highs, reflecting strong investor interest and market demand. However, despite this upward trend, Ethereum recently dropped below $3,500. The 50-day Simple Moving Average (yellow line), which had previously provided support, gave way over the weekend. On Monday, increased selling pressure pushed the price below the 100-day SMA (green line), but it quickly rebounded.
ETH/USD – Daily chart


🏆 7 Best Forex Brokers
| Broker | Website | |
|---|---|---|
| 🥇 | | Visit Broker >> |
| 🥈 | Visit Broker >> | |
| 🥉 | | Visit Broker >> |
| 4 | | Visit Broker >> |
| 5 | | Visit Broker >> |
| 6 | | Visit Broker >> |
| 7 | | Visit Broker >> |


