


GameStop Stock (GME): Primed for a Third Surge?
Based on the recent technical analysis, the GameStop stock (GME) could be ready for a third bull-run, potentially reaching a local high.
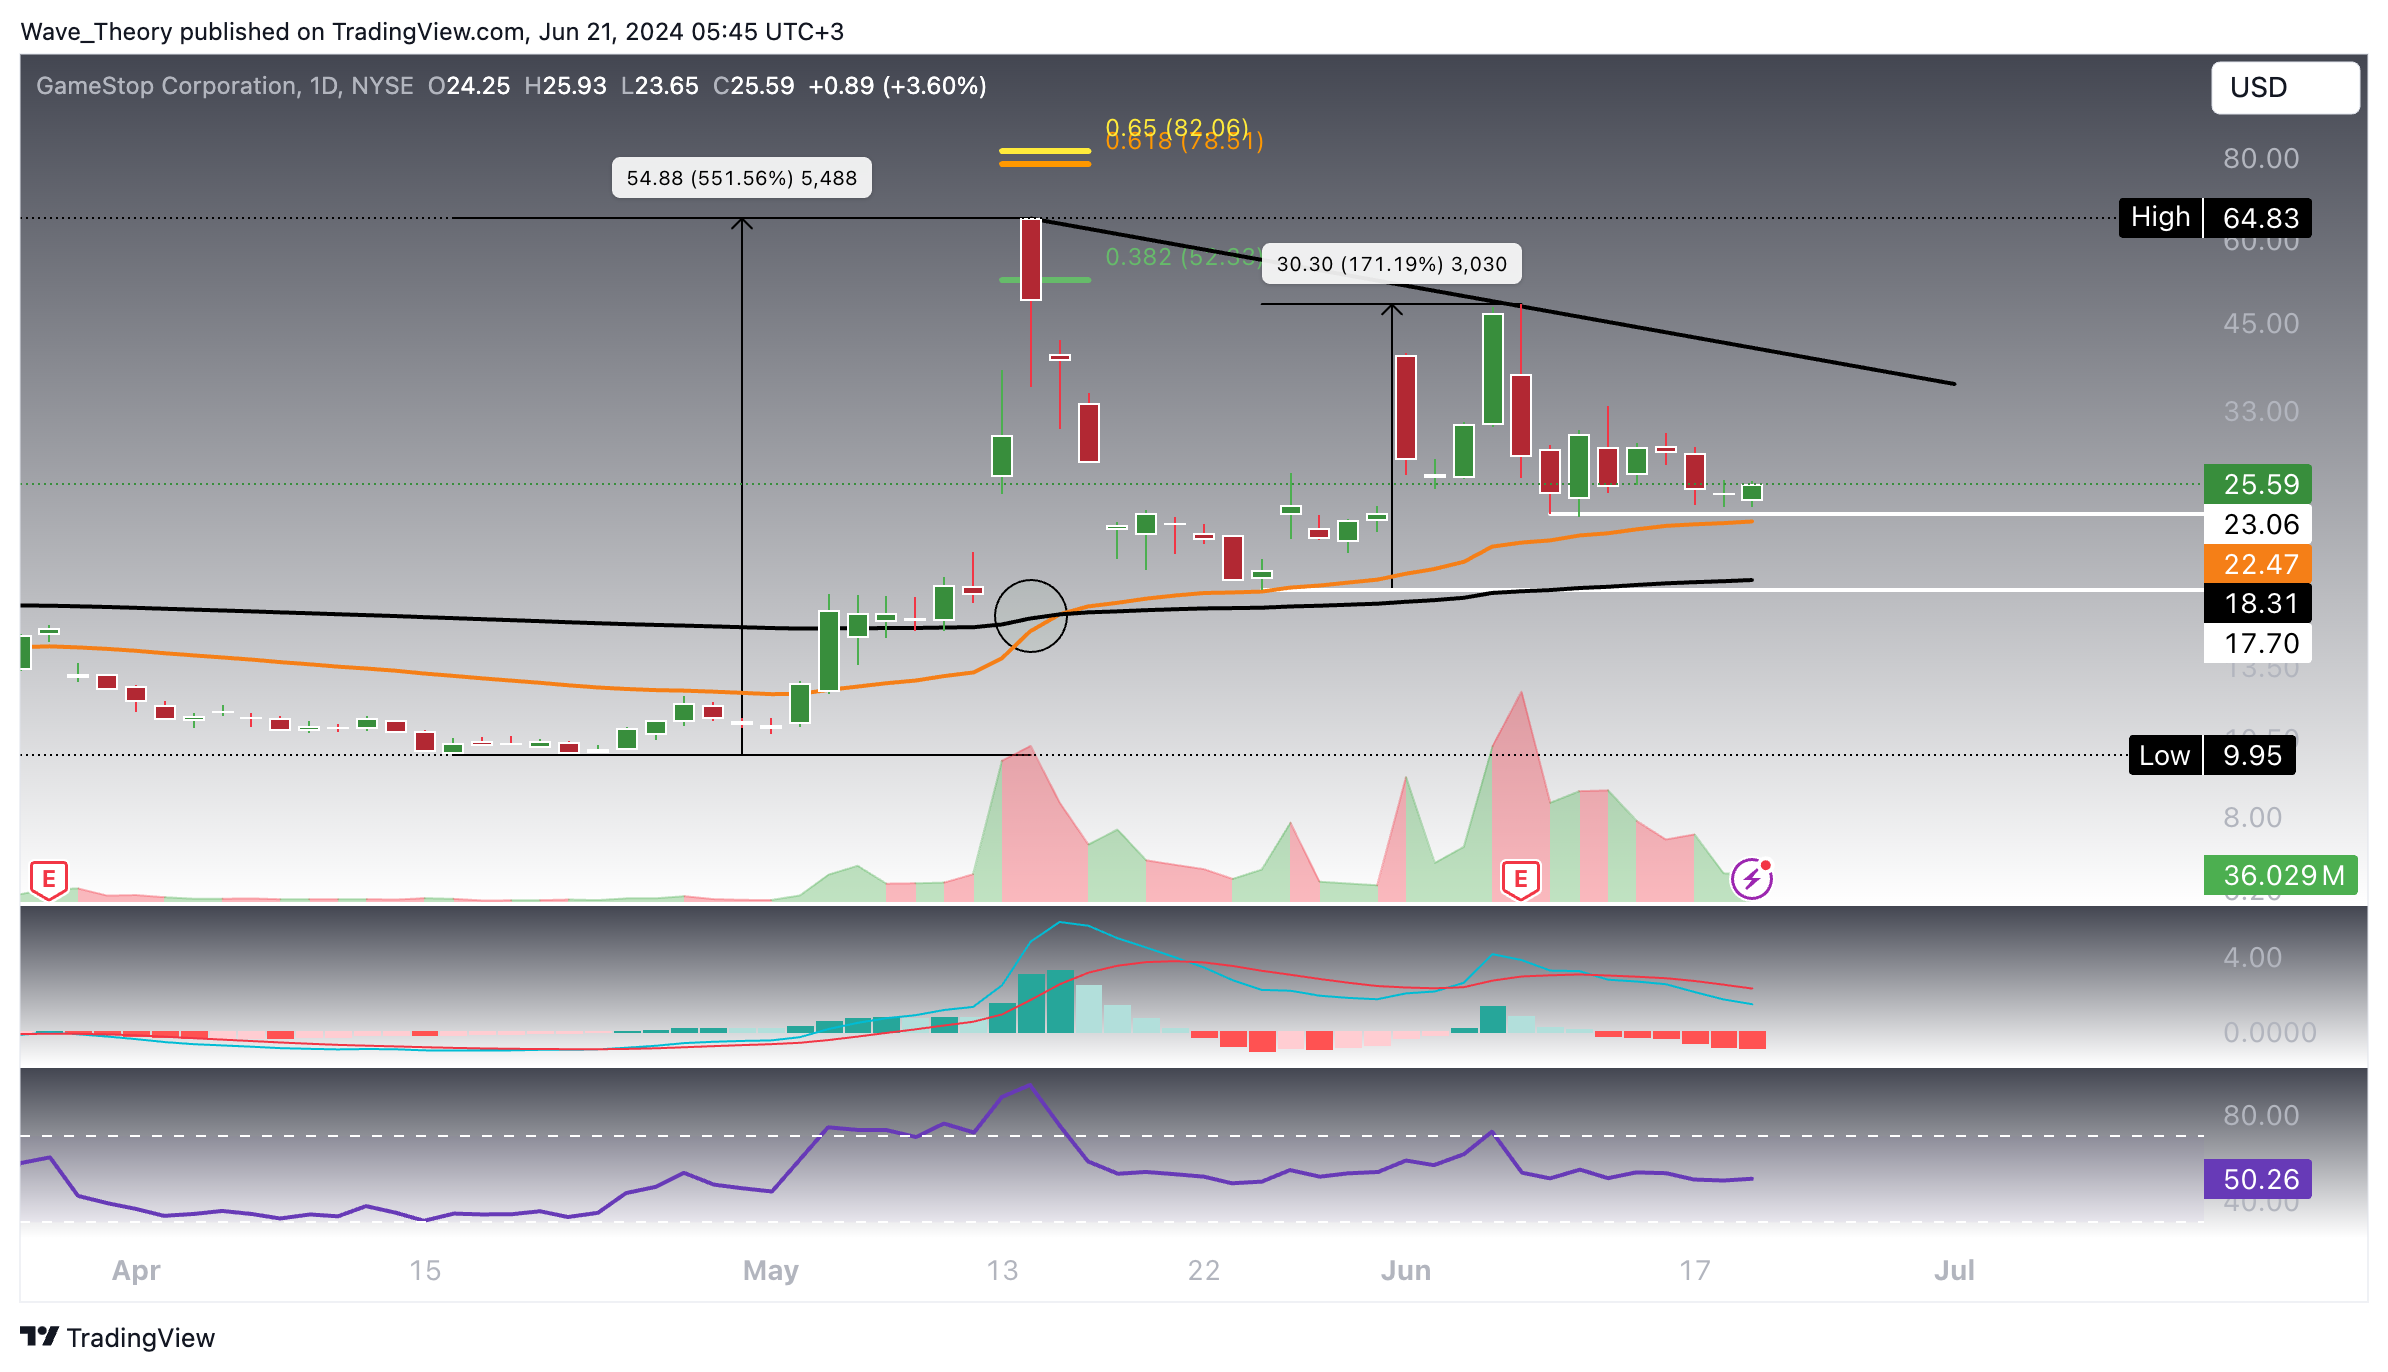
GameStop stock (GME) Had A Second Run
In our last analysis of GameStop (GME), we indicated a potential for a second run. Following a massive 551% surge during its initial run, GameStop experienced a subsequent 171% increase after finding support at the 50-day EMA at $22.5.
During this second surge, GameStop formed a lower high, indicating that the corrective phase remains active. This pattern suggests the potential for another lower high in the anticipated third run.
Technical Indicators and Trends
- MACD (Moving Average Convergence Divergence): The MACD lines have crossed bullishly, though the MACD histogram still indicates a bearish trend.
- RSI (Relative Strength Index): The RSI is in neutral territory, providing no clear bullish or bearish signals.
- EMA (Exponential Moving Average): The golden crossover of the EMAs confirms a bullish trend in the short to medium term.
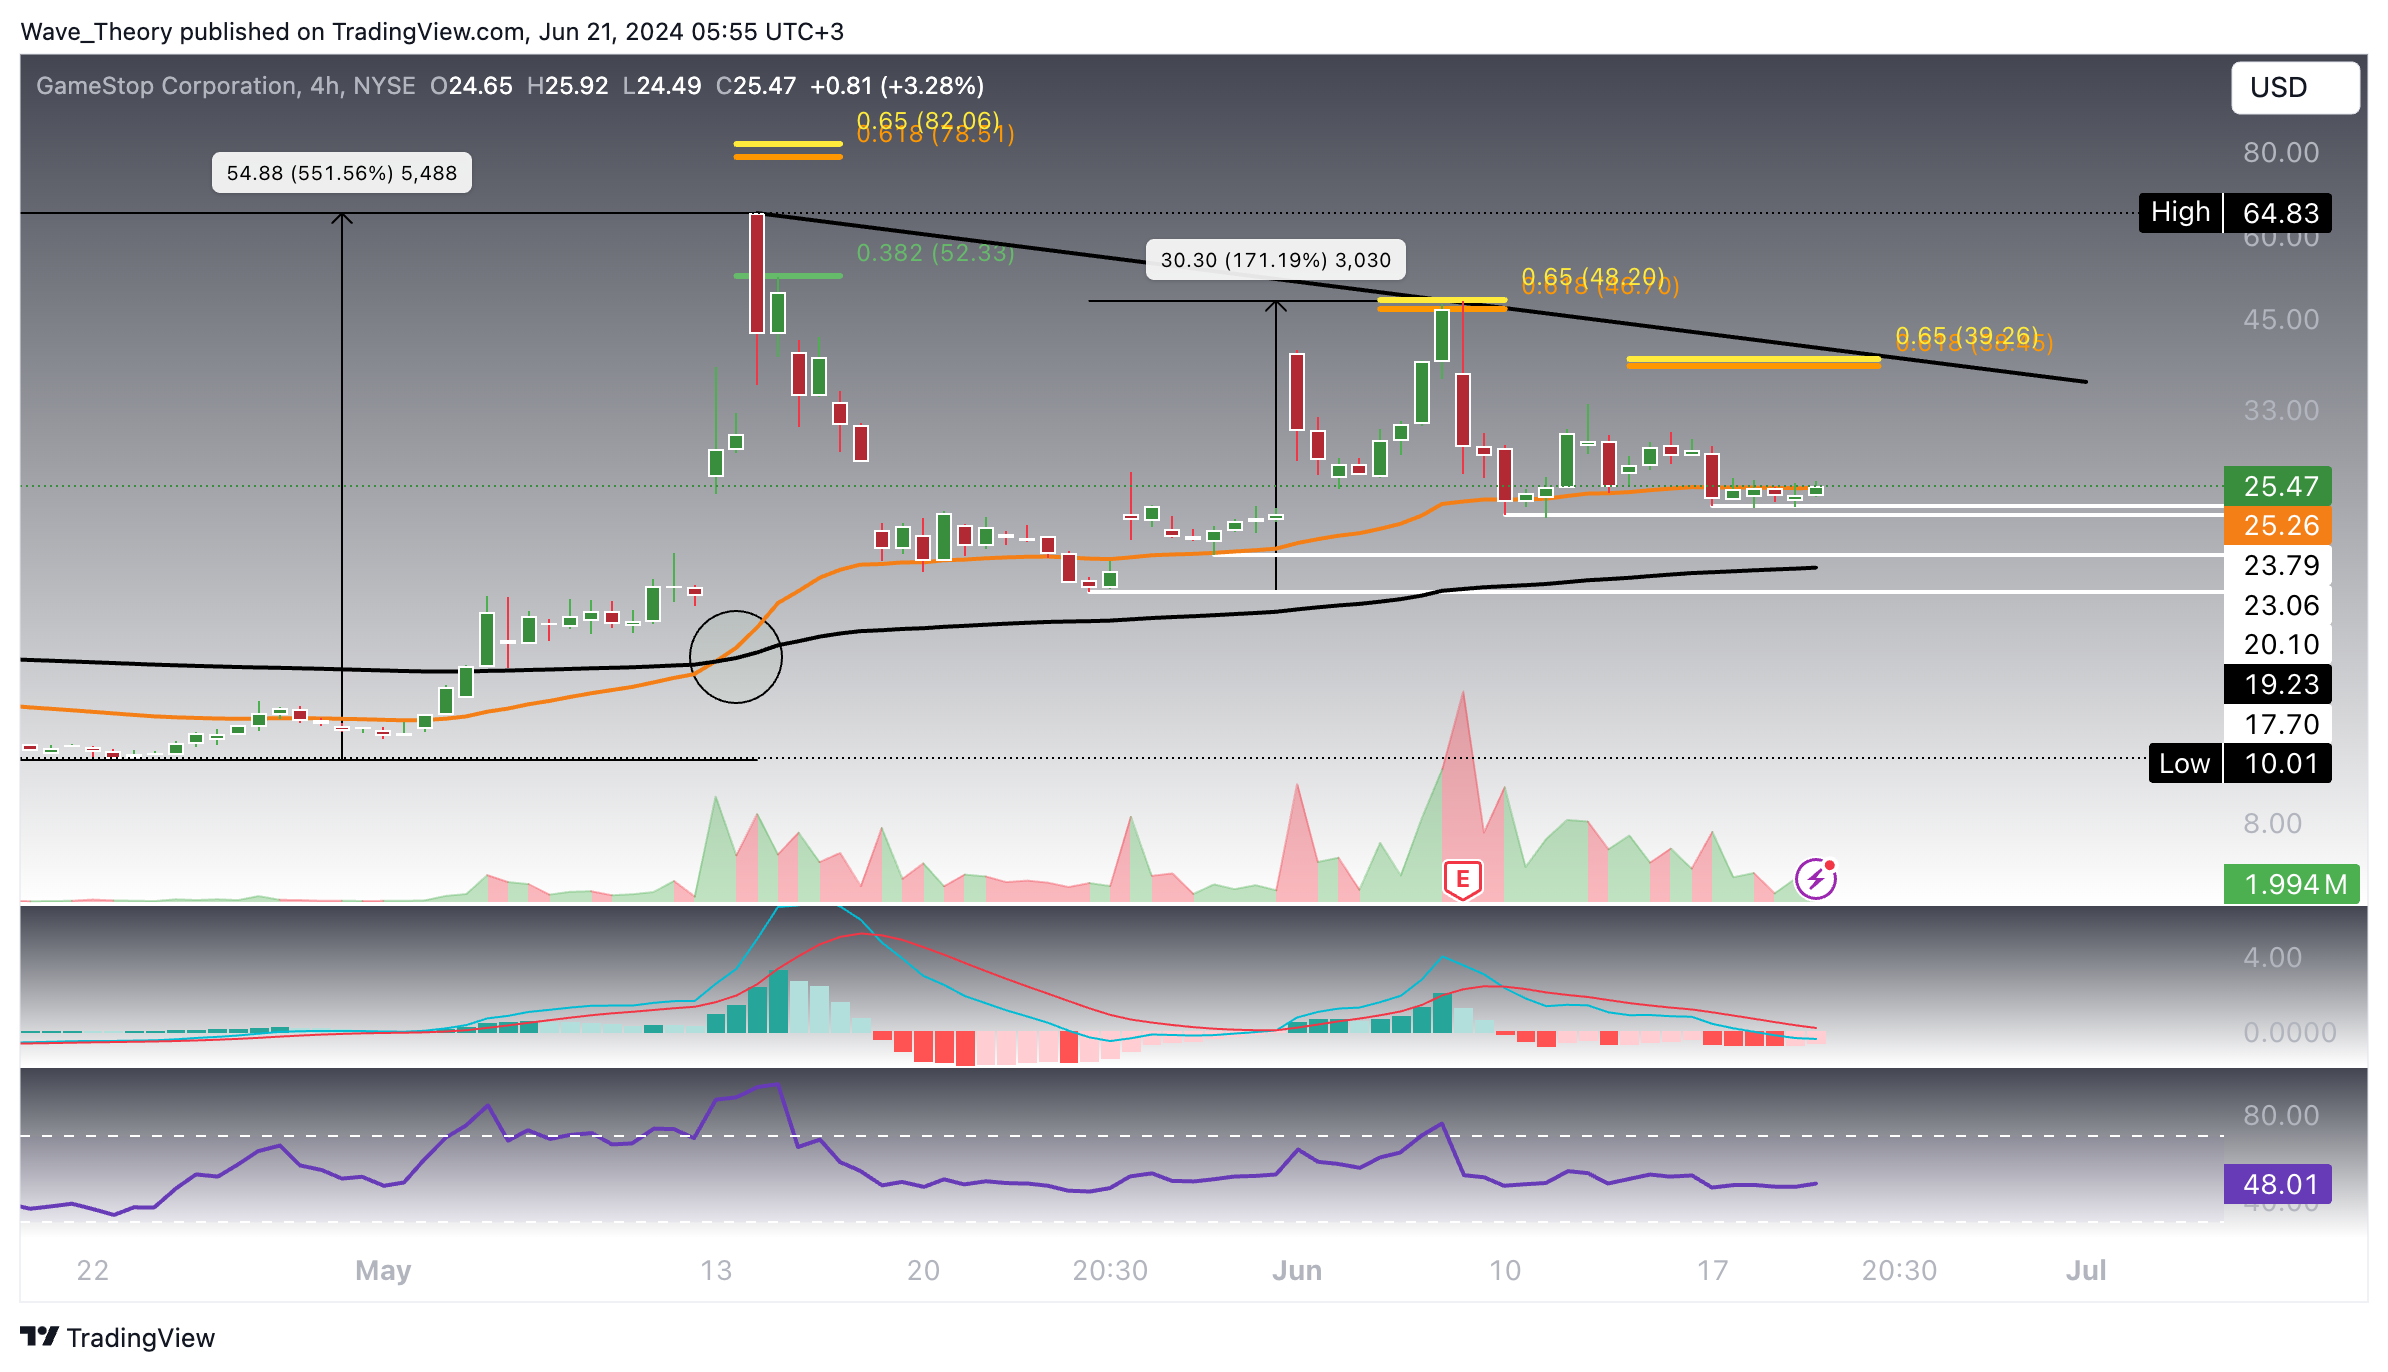
GameStop (GME): Encounter with Critical Resistance Levels
After rebounding from the 50-day EMA, GameStop surged to the golden ratio resistance at $48 but faced rejection at this level, subsequently retracing to approximately $23, where it found substantial support.
Currently, GameStop is supported between $23 and $23.8. Should this support fail, the stock could retrace further to the support zone between $17.7 and $20.1. A successful bounce from this lower support could initiate the third run.
If GameStop breaches the 50-4H EMA resistance at $25.26, it may trigger the third run, potentially surging to the next golden ratio resistance at $39.
Technical Indicators and Trends
- EMA: The golden crossover of the EMAs in the 4-hour chart indicates a short-term bullish trend.
- MACD: The MACD histogram is ticking bullishly higher, although the MACD lines remain crossed bearishly.
- RSI: The RSI provides no definitive bullish or bearish signals.
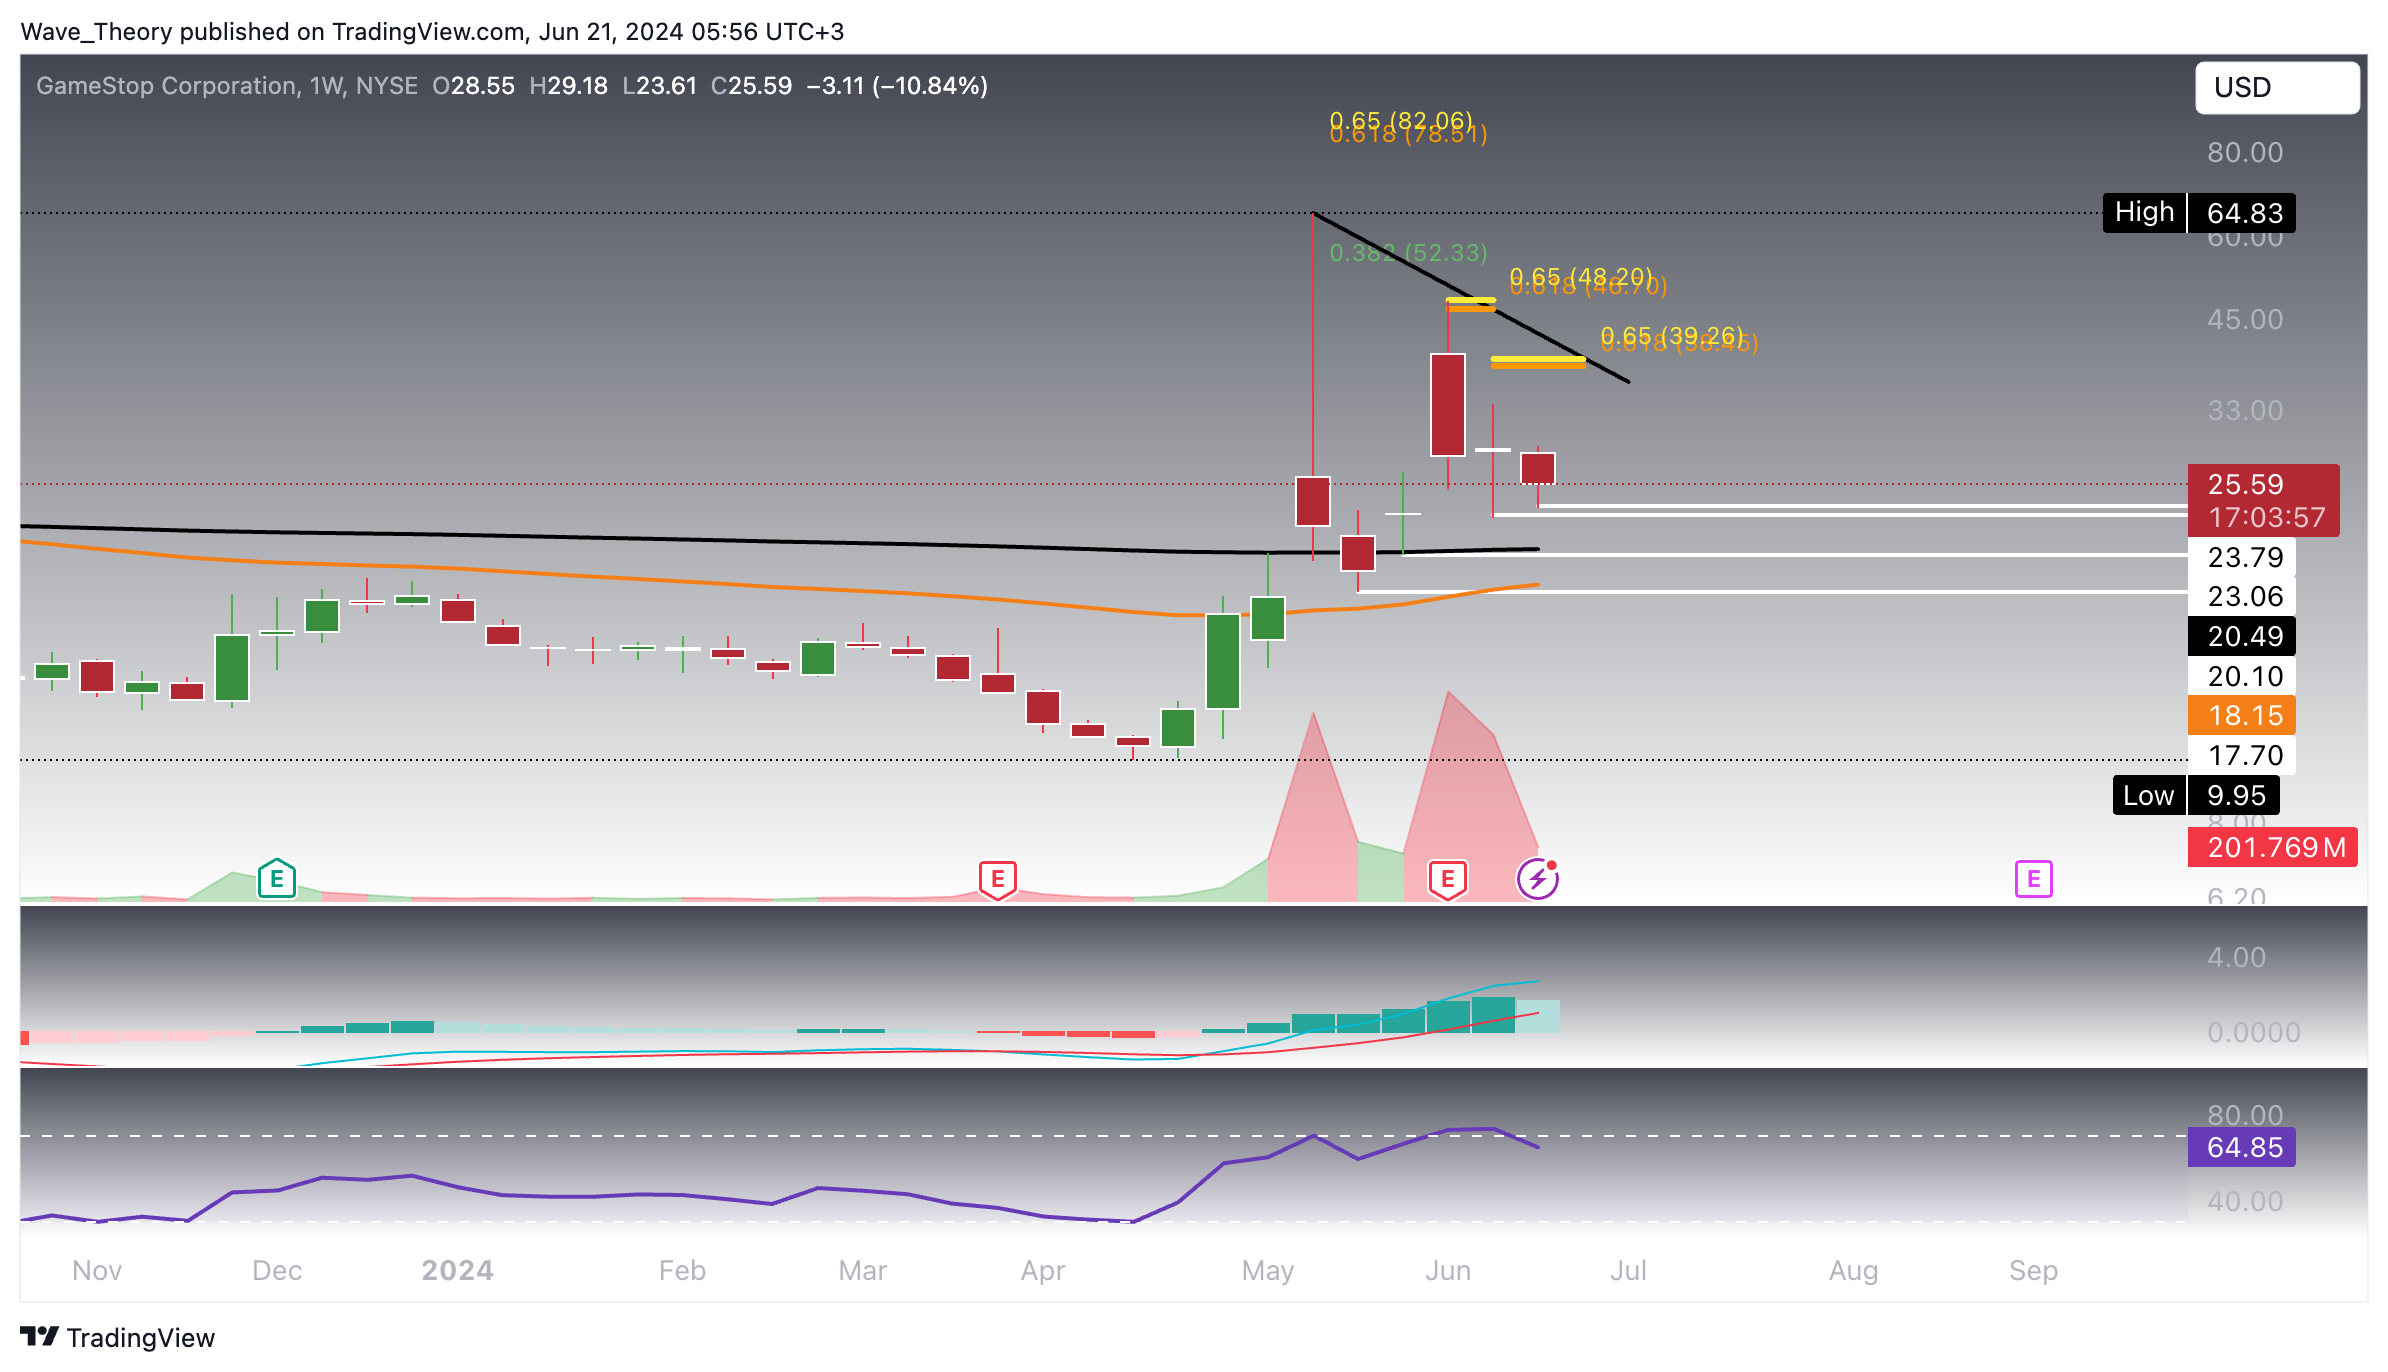
The Histogram Of The MACD Starts To Tick Bearishly Lower
On the weekly chart, GameStop does not emit any bullish signals. Instead, the MACD histogram is beginning to show bearish indications. Nevertheless, the stock maintains major support between $17.7 and $20.1, presenting a potential for a third bull run, though likely less robust than the previous two.


🏆 7 Best Forex Brokers
| Broker | Website | |
|---|---|---|
| 🥇 |  | Visit Broker >> |
| 🥈 | Visit Broker >> | |
| 🥉 |  | Visit Broker >> |
| 4 |  | Visit Broker >> |
| 5 |  | Visit Broker >> |
| 6 |  | Visit Broker >> |
| 7 |  | Visit Broker >> |


