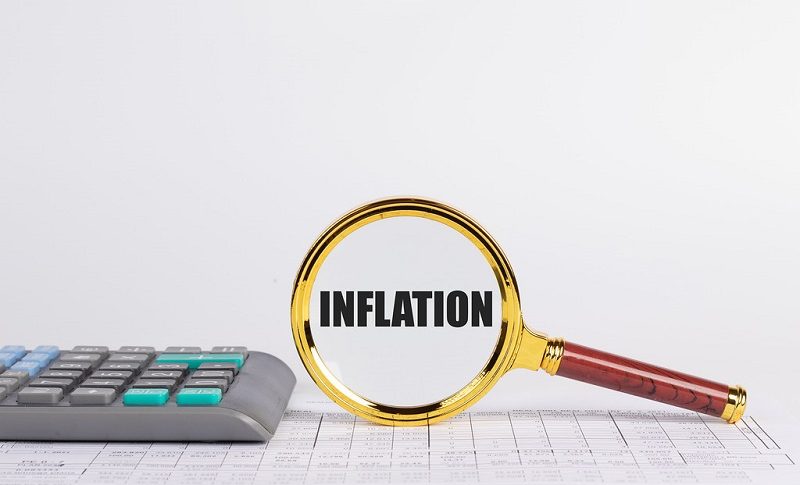
Forex Signals Brief June 20: Awaiting the SNB and BOE
In USD/JPY trading, there was a noticeable uptick in buying activity when the pair surpassed the 158.00 level, potentially spurred by reports of issues at a Japanese bank. Despite this, overall movements indicated slight strength in the US dollar during North American trading, albeit with minimal fluctuations that could be attributed to regular market fluctuations.
The Canadian dollar initially strengthened early in the day but later retraced most of its gains. Market sentiment indicates a 65% likelihood of a rate cut next month, although recent meeting minutes suggest a preference for a more gradual approach to monetary policy adjustments. Bank of Canada Governor Tiff Macklem is scheduled to deliver a speech on June 24, and Friday’s retail sales report will provide further insights into potential policy shifts. While it was challenging to discern a clear risk sentiment across markets, European and Canadian stocks showed resilience amid varying global economic conditions and uncertainties.
Today’s Market Expectations
Today started with the Swiss National Bank (SNB) meeting which cut its key policy rate by 25 basis point again, lowering it from 1.50% to 1.25%. This decision came a bit unexpected and the Swiss franc weakened following the announcement, with USD/CHF rising by 0.5% to 0.8885 on the day. The SNB also expressed readiness to intervene in the foreign exchange market if needed, emphasizing its commitment to maintaining appropriate monetary conditions. The bank highlighted that renewed geopolitical tensions could dampen global economic activity and noted that domestic services are currently the main driver of inflation in Switzerland. Alongside the rate cut, the SNB marginally lowered its inflation projections for the coming years, with 2024 now forecast at 1.3%, 2025 at 1.1%, and 2026 at 1.0%. This adjustment has contributed to the softer franc in response to the decision.
In the previous meeting, there was a somewhat more dovish tone than expected from the Bank of England, highlighted by Governor Bailey’s indication that they might consider cutting rates more aggressively than initially anticipated. Deputy Governor Ramsden also voted in favor of a rate cut, underscoring the committee’s openness to easing monetary policy. It is evident that the central bank is inclined towards rate cuts but remains cautious, preferring to gather additional confidence in economic conditions before making any adjustments to the policy rate. The upcoming tone of monetary policy is likely to be influenced by the UK Consumer Price Index (CPI) data scheduled for release the day before the meeting. This data will provide crucial insights into inflation trends and economic stability, shaping the Bank of England’s future decisions. Despite these considerations, the Bank Rate will remain unchanged at 5.25% for the time being, reflecting the central bank’s current stance amidst ongoing economic uncertainties and the need for further clarity on inflationary pressures and economic recovery.
Yesterday the USD was retreating again, so we remained long on other currencies, having a several winning trading signals in forex and commodities as well. However, in the US session stock markets started to retreat and we got caught on the wrong side with a few losing trades in the Dow Jones. We ended the day with six winning forex signals and three losing ones.
We Continue to Sell Gold at the 200 SMA
Gold rallied significantly on Wednesday, exceeding the $2,340 level, but it encountered resistance around the 100-day Simple Moving Average (SMA), resulting in a subsequent drop. Technical indicators suggest further declines, with initial support expected around the 200-day moving average at $2,290. Additionally, the monthly low of $2,286.70 serves as a critical support level in the near term. Despite recent losses, ongoing global tensions and uncertainties continue to underpin gold prices. Political instability in Europe and unrest in the Middle East have contributed to a more bullish outlook for gold, as evidenced by the rally on Friday.
XAU/USD – H4 chart
AUD/USD Remains in Consolidation Mode
Following the release of disappointing US Consumer Price Index (CPI) inflation data last Wednesday, the AUD/USD pair saw a significant rally, breaking above the 200-day Simple Moving Average (SMA). However, the price quickly retreated back into its previous range and started trending towards the lower end. Support levels around the 100-day SMA (red) on the daily chart briefly halted the downward movement. This week, as the AUD/USD pair bounced back from lower levels, extending its winning streak over three days, buyer interest revitalized. The pair surged to multi-session highs, testing levels in the upper-0.6600s. Improved sentiment in riskier markets, ongoing weakness in the US dollar (USD), and continued market adjustments following the Reserve Bank of Australia (RBA) meeting were key factors driving this upward momentum.
NZD/USD – Daily Chart
Cryptocurrency Update
MAs Turn Into Support for Bitcoin
Yesterday, despite the Australian Securities Exchange approving the first spot Bitcoin ETF listing, Bitcoin’s price dropped below $65,000. The cryptocurrency saw a steep decline of over $5,000, falling from around $70,000 to approximately $65,000. This drop coincided with substantial institutional withdrawals and significant whale activity. Key technical indicators, such as the 20-day Simple Moving Average (SMA), were breached during the decline, resulting in the closure of our sell Bitcoin signal with a $6,000 profit. Nevertheless, the 100-day SMA remains a crucial support level for Bitcoin, showing resilience against the selling pressure and prompting us to consider buying at this point.
BTC/USD – Daily chart
Ethereum Bounces Off the 50 SMA
Ethereum (ETH) has experienced fluctuations since the introduction of its ETF, reaching a peak of $3,832.50. This surge was driven by increased market confidence following the SEC’s favorable stance on spot Ether ETFs. From its previous highs, Ethereum’s price has climbed by 25%, reflecting strong investor interest and market demand. Despite this bullish trend, Ethereum’s price recently dipped, with ETH/USD falling below $3,500. However, over the weekend, there was a positive reversal, suggesting that Ethereum’s price may rise again, supported by the solid backing of the 100-day Simple Moving Average (SMA).
ETH/USD – Daily chart