


Where Is GBP/USD Headed As UK Inflation CPI Slows?
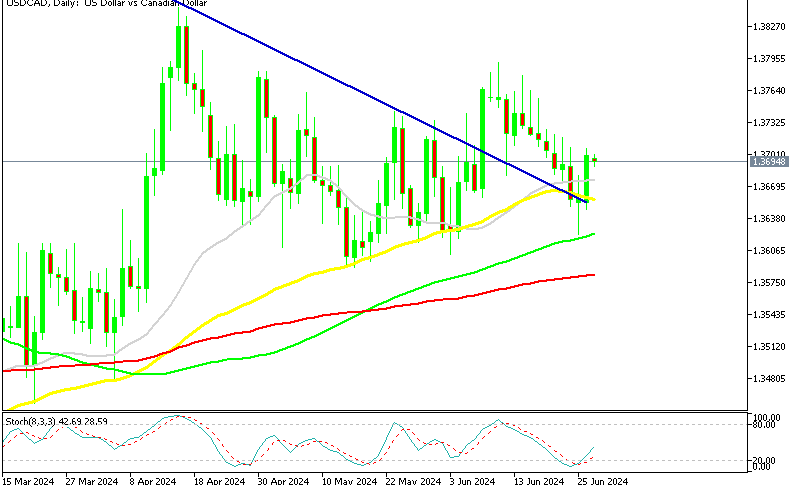
GBP/USD has been on a strong upward trend for the past two months, starting from mid-April. However, recent developments have changed its course, leading to a decline in this pair. Following the hawkish FOMC meeting last week, GBP/USD dropped by 200 pips, but found support at the 200 SMA on the H4 chart.

| Broker | Review | Regulators | Min Deposit | Website | |
| 🥇 |  | Read Review | ASIC, FSA, CBI, BVI, FSCA, FRSA, CySEC, ISA, JFSA | USD 100 | Visit Broker >> |
| 🥈 | Read Review | FMA, FSA | USD 50 | Visit Broker >> | |
| 🥉 |  | Read Review | FSCA, CySEC, DFSA, FSA, CMA | USD 0 | Visit Broker >> |
| 4 |  | Read Review | SFSA, FSCA, CySec* | USD 5 | Visit Broker >> |
| 5 | Visit Broker >> | Read Review | FCA, CySEC, FSCA, SCB | USD 100 | Visit Broker >> |
| 6 |  | Read Review | FCA, FINMA, FSA, ASIC | USD 0 | Visit Broker >> |
| 7 |  | Read Review | CySEC, FCA, FSA, FSCA, Labuan FSA | USD 100 | Visit Broker >> |
| 8 |  | Read Review | Not Regulated | 0.001 BTC | Visit Broker >> |
| 9 |  | Read Review | ASIC, CySEC, FSCA, CMA | USD 100 | Visit Broker >> |
| 10 |  | Read Review | SVGFSA | USD 5 | Visit Broker >> |
Yesterday, the Pound Sterling bounced higher against the US Dollar, even in the absence of significant economic data from the UK, following the release of disappointing economic figures from the United States. Retail sales in the US declined in May, and April’s data was also revised to negative territory, leading to a drop in the USD. As a result, GBP/USD climbed approximately 50 pips, rising above the 1.27 level.
GBP/USD Chart H4 – The 200 SMA Held As Support
Today, the release of the UK CPI inflation data indicated a deceleration in May. This shift in inflation trends suggests potential adjustments in market expectations regarding future monetary policy moves by the Bank of England, contributing to the pair’s recent downward trajectory.
UK May CPI Inflation Report
- Headline CPI: The Consumer Price Index (CPI) increased by 2.0% year-on-year, which is in line with expectations. This is a decrease from the previous month’s 2.3%. Monthly, the headline inflation rose by 0.3%.
- Core CPI: Core CPI, which excludes volatile items such as food and energy, increased by 3.5% year-on-year, also matching expectations. This is a reduction from the prior reading of 3.9%. On a monthly basis, core inflation rose by 0.5%.
- Services Inflation: Services inflation, a significant component indicating underlying inflationary pressures, remains high at 5.7%, although it has slightly decreased from 5.9% in April.
The slight decrease in both headline and core CPI from the previous month suggests that some inflationary pressures might be easing. However, the year-on-year core inflation rate is still significantly above the headline rate, indicating persistent underlying inflationary pressures. The persistently high services inflation at 5.7%, though slightly lower than the previous month, suggests that inflation in the service sector is still a concern. Services inflation often reflects wage growth and other domestic cost pressures, which can be more persistent and harder to control.
GBP/USD Live Chart


🏆 7 Best Forex Brokers
| Broker | Website | |
|---|---|---|
| 🥇 |  | Visit Broker >> |
| 🥈 | Visit Broker >> | |
| 🥉 | | Visit Broker >> |
| 4 |  | Visit Broker >> |
| 5 |  | Visit Broker >> |
| 6 | | Visit Broker >> |
| 7 |  | Visit Broker >> |


