Polygon (MATIC) Price Slides Despite zkEVM+ Launch and Enterprise Adoption
Polygon (MATIC) is experiencing a price decline despite positive developments like the launch of zkEVM+ and growing enterprise adoption.
Polygon (MATIC) is experiencing a price decline despite positive developments like the launch of zkEVM+ and growing enterprise adoption.
zkEVM+ Unveiled for Enhanced Security and Privacy
Ternoa, a blockchain infrastructure company, launched zkEVM+, a new L2 scaling solution built on Polygon CDK. zkEVM+ offers security benefits through integrity proofs and native privacy for developers building on the Ethereum ecosystem.
This development leverages Polygon’s technology and Ternoa’s expertise to potentially improve scalability and user experience.
Enterprise Adoption Gains Traction
Ternoa boasts a large social media following and established partnerships with prominent French corporations. Their privacy stack is already being utilized by various dApps, including Time Guardian and Keeper DeFi. This demonstrates Polygon’s potential for real-world use cases beyond speculation.
MATIC Price Faces Downturn
MATIC’s price has fallen 3.91% in the past 24 hours and 9% over the past week, currently trading around $0.60. Trading volume and circulating supply have also decreased, indicating a potential lack of investor confidence. Bollinger Bands analysis suggests heightened volatility, with wider bands on both daily and weekly charts.
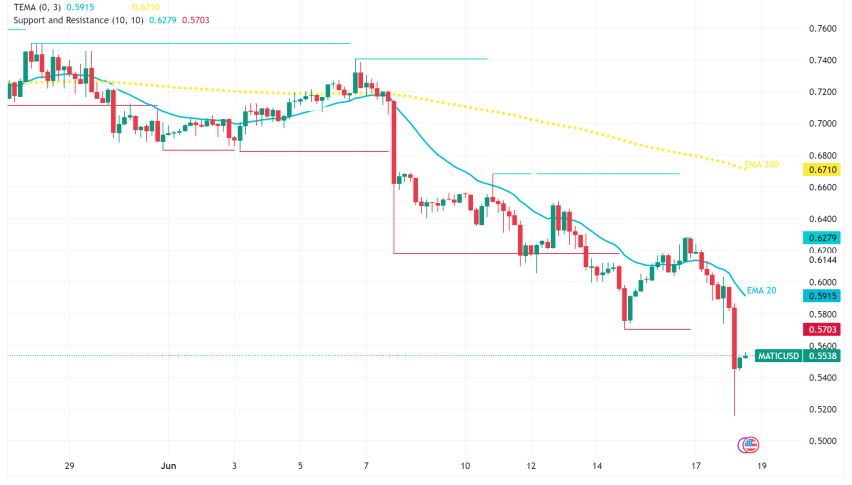
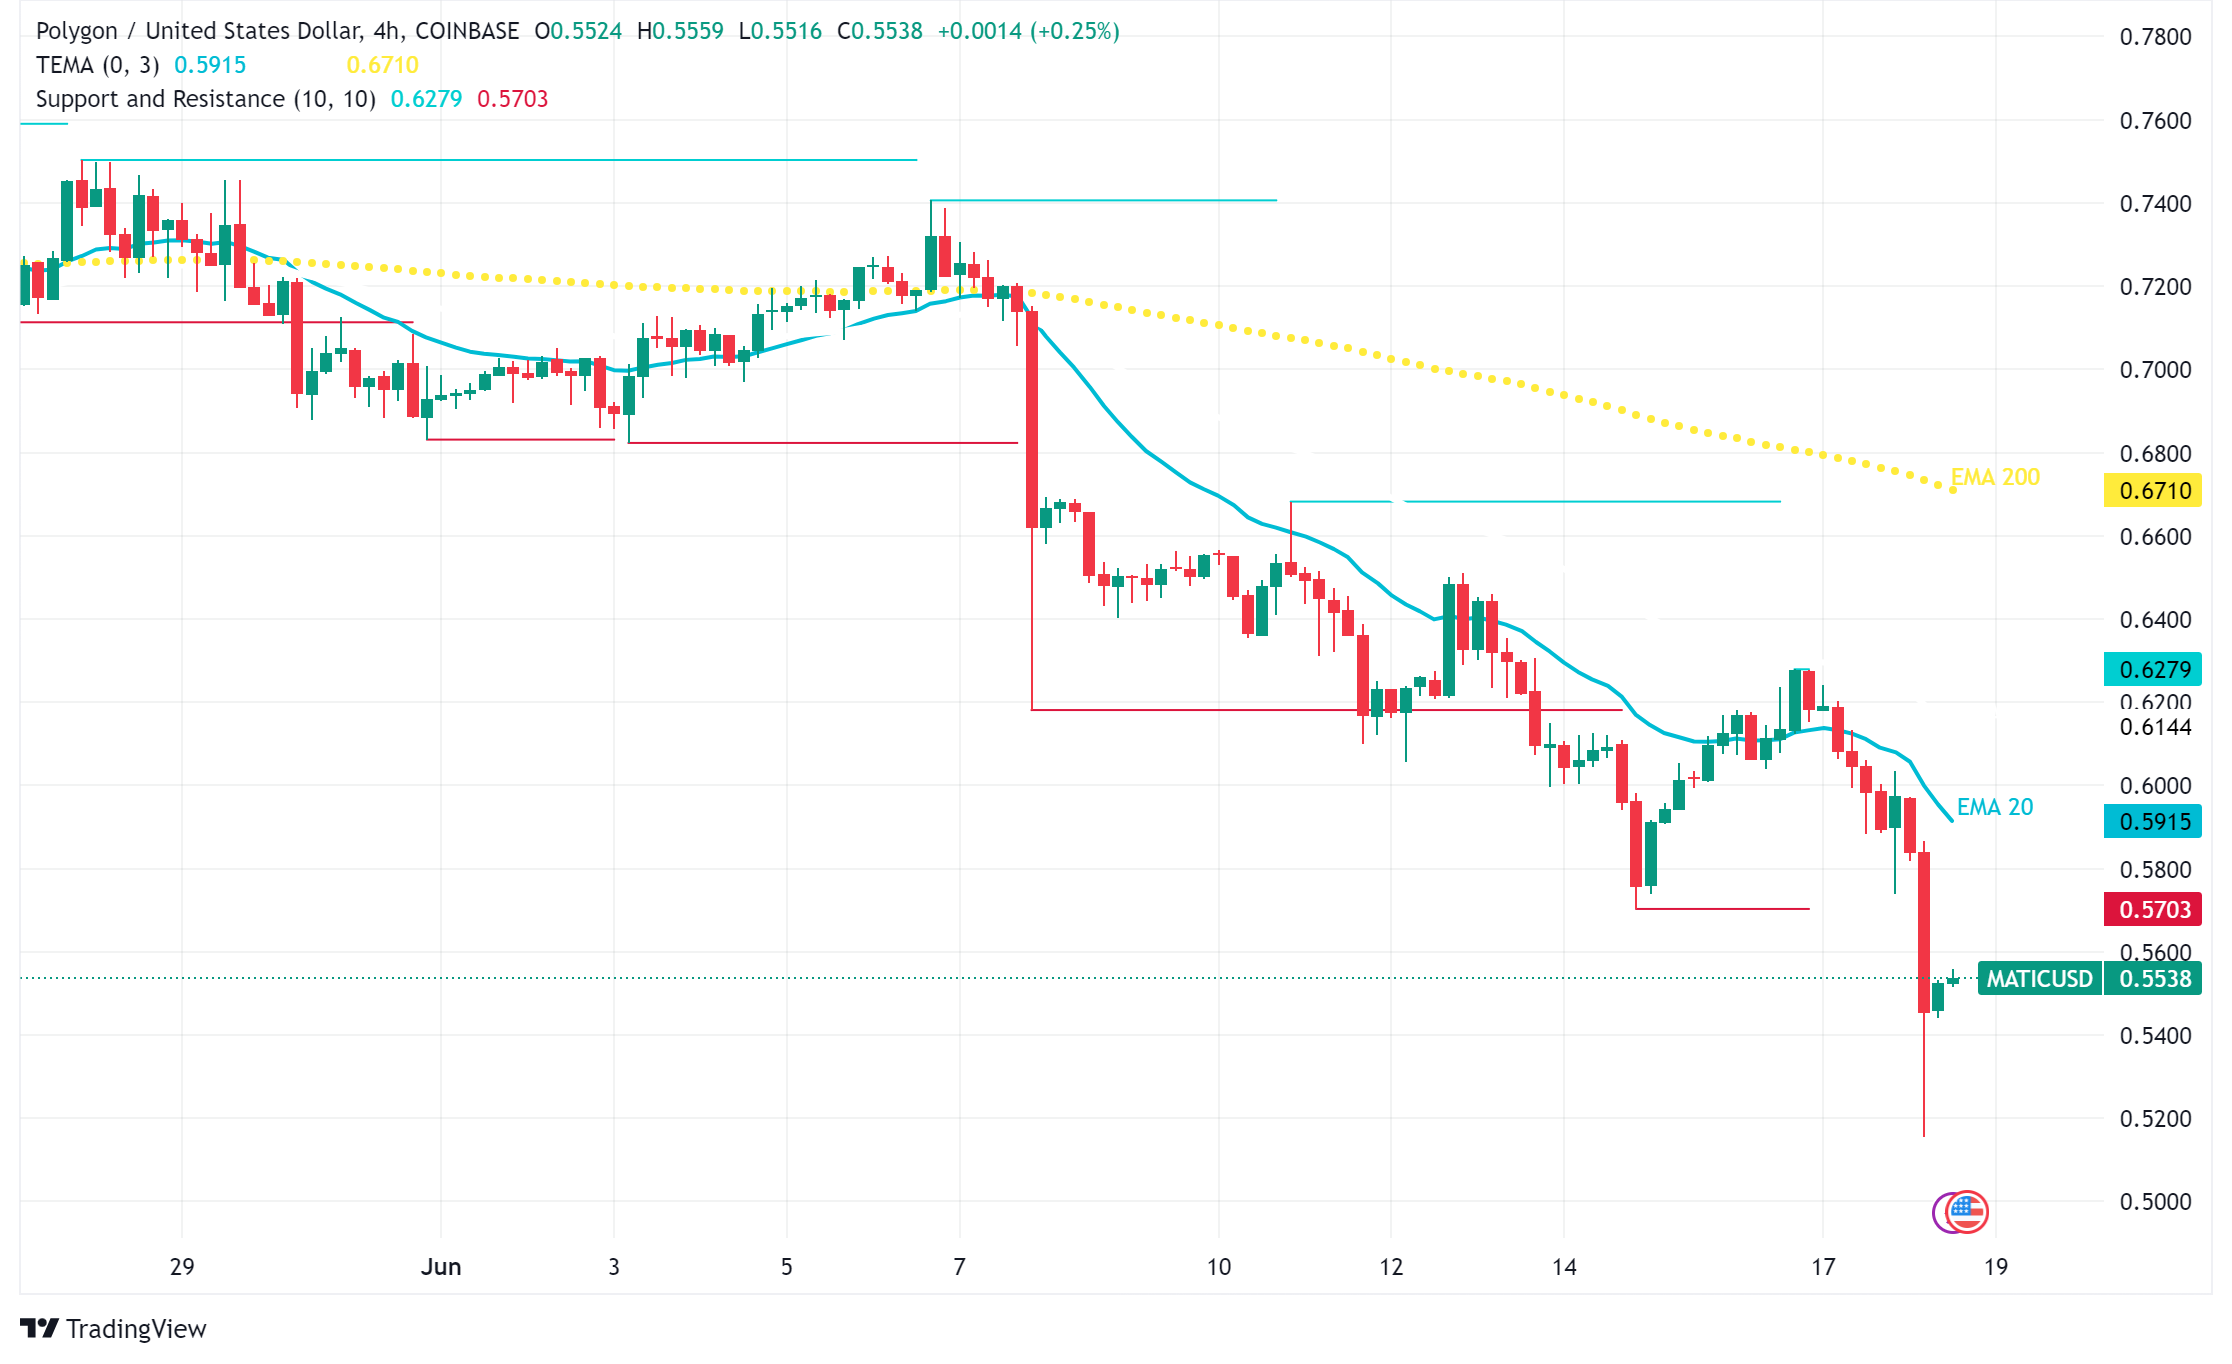
MATIC/USD Technical Analysis Points to Resistance Levels
MATIC recently dipped below $0.52, testing its support level. Despite a small recovery, resistance remains around $0.5650 and $0.5720. Key technical indicators like MACD and RSI suggest bearish momentum in the short term.
- Check out our free forex signals
- Follow the top economic events on FX Leaders economic calendar
- Trade better, discover more Forex Trading Strategies
- Open a FREE Trading Account