


NIKKEI Halts Recent Rally – BoJ Intervention and Specter of Rising Bond Yields Weigh

While the Fed and other major central banks around the world contemplate the timing of initiating monetary easing, the BoJ has a completely different task ahead.
The weak yen and inflation still above the central bank’s 2% target are putting the BoJ in the opposite position to many of its peers. Investors are becoming concerned that the BoJ will intervene again in the bond and forex markets.
The BoJ has revealed that it bought ¥9.788 trillion in the week from April 26 to May 29. That’s its largest intervention ever, and helped rally the yen from around 160 to 154. The central bank admits intervention alone isn’t enough to keep forex rates in line, macro dynamics must align also.
A weak yen will lead to higher inflation from imports and impact the performance of the domestic stock market negatively. Adding to these concerns are rising bond yields. The Ministry of Finance has been buying less JGBs throughout 2024.
The net result is higher bond yields. Overnight, the 10-year JGB auction saw an average yield of 1.048%, a sharp rise from the auction last month which returned an average yield of 0.857%. The last quarter of the year could prove to be tough for the NIKKEI225 as the Fed is expected to cut rates, while the BoJ is expected to tighten.
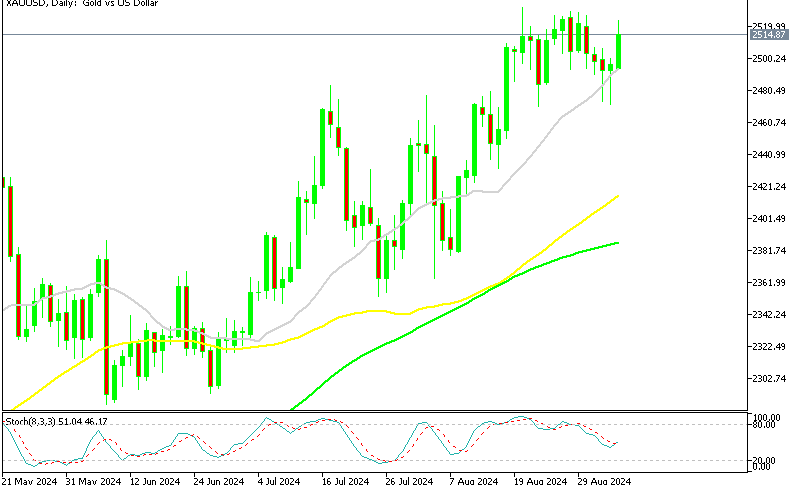
Technical View
The day chart below for the NIKKEI225 shows the market attempted to break through the Ichimoku cloud for the third time to reestablish a bullish trend. The failure to break above the cloud isn’t complete yet. The market would need to fall below the cloud to confirm the failure.

Yesterday’s candle was the third attempt that was rejected for now. While today’s candle hasn’t managed to get past the previous high of 38,893 from February 16 (green line), at least for now. Should the market break below the cloud the next support would be at 37,611, a low reached on May 30.
Further declines would meet resistance at 36,732 (black line), which was a low set in April. From the broader view of the chart, we can see that the sloping rectangular formation (yellow area) was broken to the downside on May 29.
The market then made a typical retracement and was caught again in the cloud. My view is that the correction after the breakout hasn’t breached the rectangular formation, and that the bearish signal given from the breakout is still valid.


| Broker | Website | |
|---|---|---|
| 🥇 |  | Visit Broker |
| 🥈 | Visit Broker | |
| 🥉 |  | Visit Broker |
| 4 |  | Visit Broker |
| 5 |  | Visit Broker |
| 6 |  | Visit Broker |
| 7 |  | Visit Broker |
