


S&P 500 Drops to $5,235 Amid Weak US Dollar and Rising Geopolitical Tensions
During the European trading session, the S&P 500 (SPX) has been on a bearish track, trading under pressure around the $5,235.48 level and hitting an intra-day low of $5,222.10.
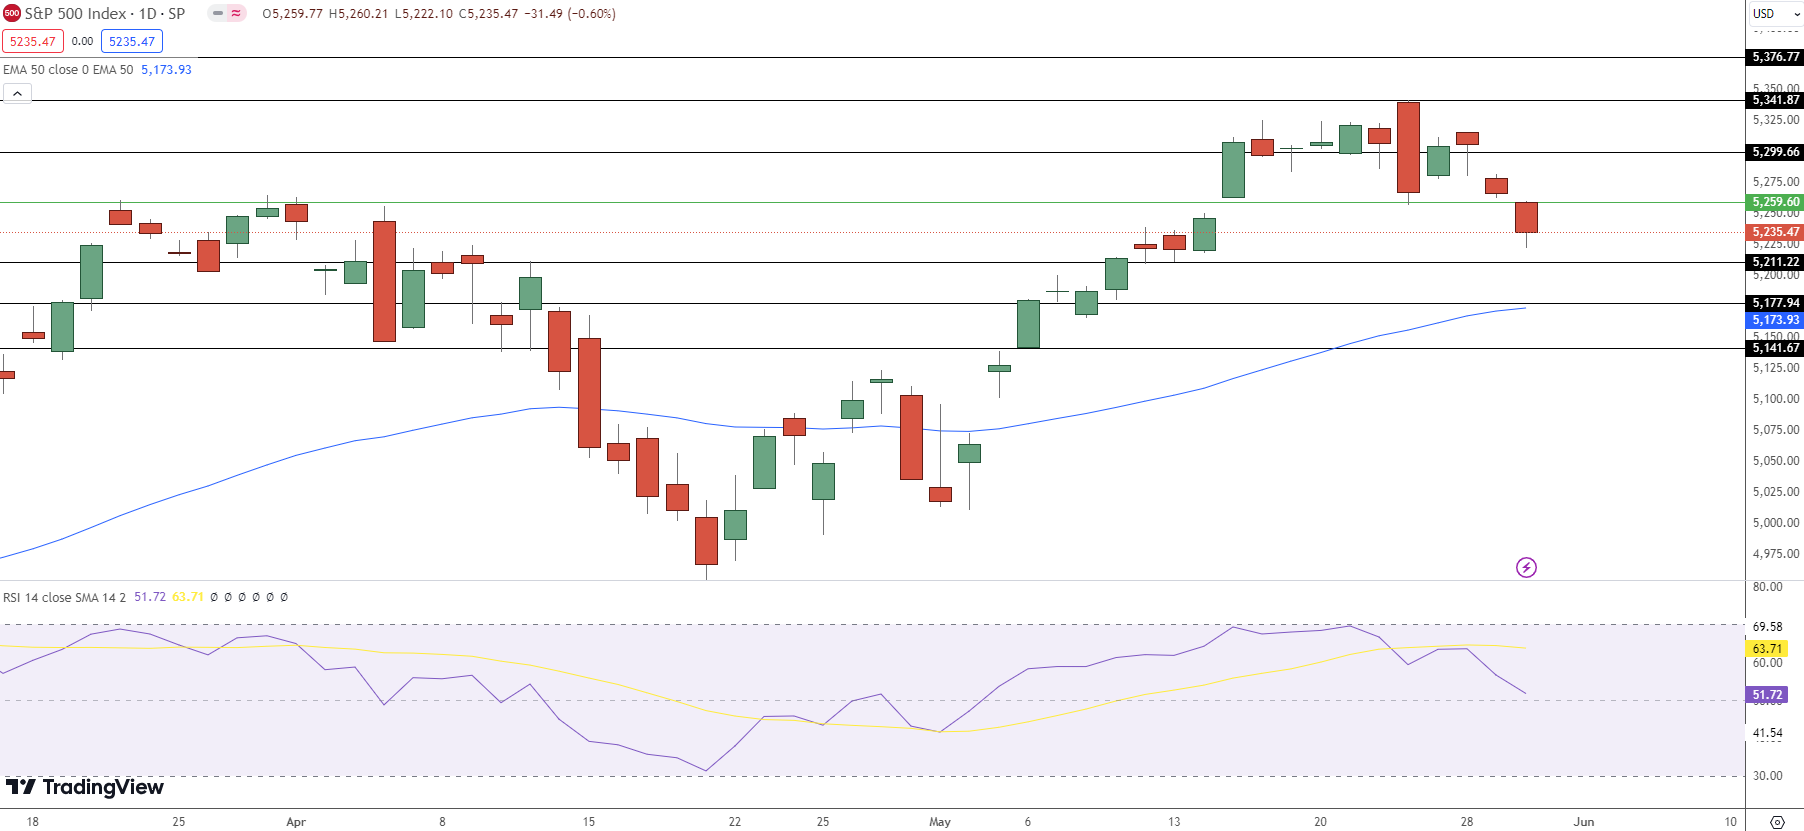
This marks the largest two-week decline for the index since September 2022. The downturn can be attributed to weak economic data, dollar weakness, and geopolitical tensions.
On the economic front, the second estimate of US GDP showed a revised growth rate of 1.3% for Q1, down from the previous estimate of 1.6%, signaling slower-than-expected economic expansion. This revision, particularly driven by lower consumer spending, has raised concerns about the sustainability of the economic recovery, dampening investor confidence. Additionally, US weekly Initial Jobless Claims for the week ending May 25 increased slightly to 219K from 216K, slightly above the market consensus of 218K.
Geopolitical Tensions Drive Volatility
Geopolitical tensions, particularly in the Middle East, have also contributed to heightened volatility in the S&P 500 index. Recent conflicts involving Israel and Gaza have raised concerns among investors, prompting a flight to safe-haven assets. The situation escalated further with Israel asserting control over Gaza’s land border with Egypt, potentially destabilizing regional dynamics. UN experts are urging decisive international action, including sanctions and an arms embargo against Israel, highlighting the potential for further escalation and its implications for global stability.
Fed Rate Hike Concerns
Moreover, market participants are closely monitoring inflationary pressures, focusing on the personal consumption expenditures price index, the Federal Reserve’s preferred inflation gauge.
Several Fed officials have indicated little confidence in beginning to trim interest rates soon. Consequently, traders are adjusting their expectations, reflecting uncertainty regarding the Fed’s future policy actions.
The probabilities of interest rate cuts before September are currently low, further intensifying downward pressure on the S&P 500.
S&P500 Price Forecast:
The S&P 500 is currently priced at $5,235.47, down 0.06%. The pivot point for today’s session is at $5,257.78. Immediate resistance levels are at $5,322.57, $5,370.18, and $5,419.82.
On the downside, immediate support is found at $5,200.92, followed by $5,149.35 and $5,103.06.
The 50-day Exponential Moving Average (EMA) is currently at $5,208.72, indicating potential support close to the current price. The Relative Strength Index (RSI) stands at 41, suggesting the market is in bearish to neutral territory.


| Broker | Website | |
|---|---|---|
| 🥇 |  | Visit Broker |
| 🥈 | Visit Broker | |
| 🥉 |  | Visit Broker |
| 4 |  | Visit Broker |
| 5 |  | Visit Broker |
| 6 |  | Visit Broker |
| 7 |  | Visit Broker |
