US Home Sales Remain in Range, USDCHF Holds Above 0.90
Since early March, the CHF to USD rate has been trading within a range, with USD/CHF stabilizing above the 0.90 level.
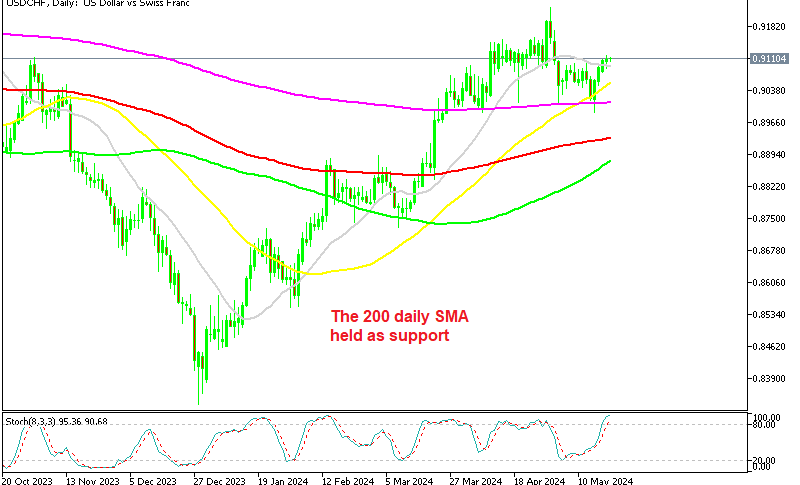
Since early March, the CHF to USD rate has been trading within a range, with USD/CHF stabilizing above the 0.90 level. There was a surge in USD/CHF over 0.92 earlier this month, but buyers couldn’t hold the gains up there and it was followed by a retreat back to the 0.90 zone which held the decline.
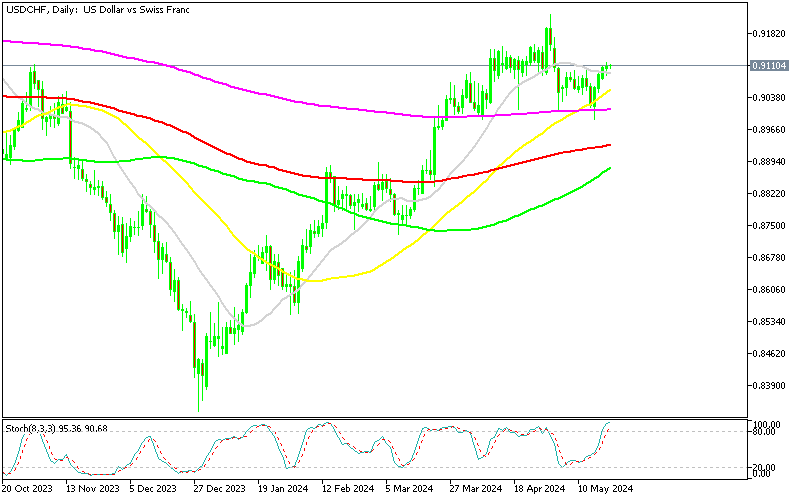
USD/CHF Chart Daily – The 200 SMA Held As Support
The 0.90 level continues to act as support for USD/CHF , with buyers consistently returning at this level. So, given the support around the 0.90 area and the repeated buying interest, we maintain a bullish bias on the USD against the Swiss franc. We’re looking to trade long on the US dollar against the Swiss franc, particularly on pullbacks to the 0.90 level, after the last one closed in profit.
Since the beginning of 2024, the pair has been climbing within a channel, indicating a sustained uptrend over the medium term. When examining the mid-term trend using the daily chart, it confirms the presence of an uptrend, especially since the 200 SMA (purple) at 0.90 is holding.
This aligns with the principle of following the trend, suggesting that the upward movement is likely to continue. After all, if something can’t go down, it will go up sooner or later. However, there’s uncertainty about the short-term future. Last week, the price closed below the 200 SMA (purple), indicating a potential break in the short-term uptrend. But buyers rushed back and yesterday the price climbed above 0.91. Today we had the US Existing Home Sales for April.
US Existing Home Sales for April
Key Data Points:
- Existing Home Sales: 4.14 million (below the estimate of 4.21 million)
- Prior Month’s Sales (March): Revised to 4.22 million from 4.19 million
- Monthly Decline: -1.9%
- Month’s Supply: 3.5 months (up from 3.2 months in March)
- 30-Year Mortgage Rate: 7.05%
- Supply of Homes Over $1 Million: Up 40% year-over-year
- Median Home Price: $407,600 (up 5.7%, a record high)
- First-Time Buyers: 33% of sales (up from 29% last year)
- All Cash Sales: 28%
Analysis:
The latest data on existing home sales in the US for April indicates a mixed picture of the housing market, marked by several key trends:
- Sales Volume: Existing home sales fell to 4.14 million, missing the estimate of 4.21 million and showing a -1.9% decline from the previous month. This decline suggests a cooling in the housing market, potentially influenced by rising mortgage rates and affordability challenges.
- Inventory and Supply: The months’ supply of homes increased to 3.5 months from 3.2 months in March. This increase indicates a slight easing of the previously tight inventory conditions, although supply remains constrained relative to demand.
- Mortgage Rates: The 30-year mortgage rate is at 7.05%, significantly higher than in previous years. High mortgage rates are likely dampening demand, especially among first-time buyers and those looking to upgrade from their current homes.
- High-End Market: There is a notable increase in the supply of homes priced over $1 million, up 40% year-over-year. This segment of the market appears less affected by higher interest rates, possibly due to buyers in this category having more financial flexibility or paying in cash.
- Home Prices: The median home price has reached a record high of $407,600, up 5.7% from the previous year. This rise in home prices continues to outpace wage growth, exacerbating affordability issues for many potential buyers.
- Buyer Demographics: First-time buyers constituted 33% of the market, an increase from 29% last year. This suggests that, despite higher prices and interest rates, there remains strong interest from new entrants into the housing market.
- Cash Sales: All-cash sales account for 28% of transactions, indicating a significant portion of buyers are not reliant on financing, which may help sustain higher price levels even amid rising mortgage rates.
Market Implications:
- Supply and Demand Imbalance: The continued imbalance between supply and demand, with insufficient housing inventory, is pushing prices higher. This dynamic benefits existing homeowners, who feel wealthier and are more confident in their spending, but it presents challenges for prospective buyers facing high prices and borrowing costs.
- Homebuilder Impact: Homebuilders face high carry costs and may be cautious in expanding supply due to the high mortgage rates and affordability issues that are limiting buyer demand.
- Economic Effects: High home prices and limited affordability can act as a brake on the broader economy by limiting mobility and spending flexibility for new homebuyers, which in turn can influence broader economic growth and consumer spending patterns.
USD/CHF Live Chart
- Check out our free forex signals
- Follow the top economic events on FX Leaders economic calendar
- Trade better, discover more Forex Trading Strategies
- Open a FREE Trading Account
- Read our latest reviews on: Avatrade, Exness, HFM and XM
Related Articles


Sidebar rates
Related Posts
