NZD/USD Bounces on Better Employment, RBNZ Rate Hike Calls
The New Zealand dollar has been bearish. But fundamentals have improved for the NZD and now the price is facing the last resistance


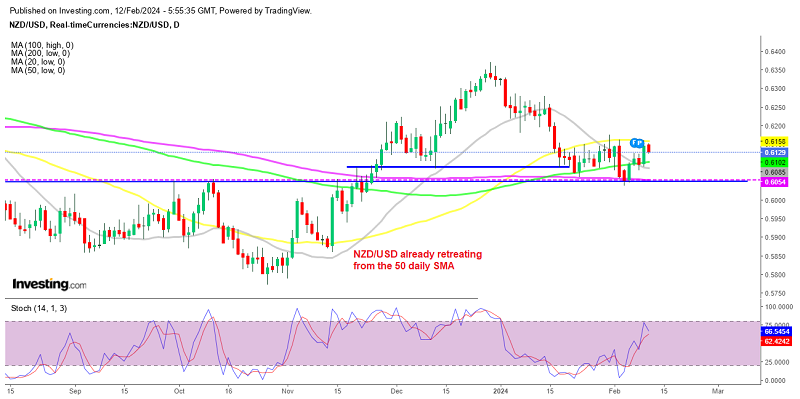
The New Zealand dollar has been bearish, with NZD/USD losing around 350 pips during January and the first week of February. But last week we saw a strong bounce on positive fundamentals for the NZD and now the price is facing the last MA as resistance in the daily chart.
Early this month, NZD/USD escalated the downtrend, breaking below the support zone at 0.6050, as well as below the 200 SMA as the slide continued following the USD’s strong NFP news and a hawkish FED. But last week we saw a reversal in the price, as buyers stepped in, sending this pair more than 100 pips higher, pushing the price above most moving averages.
Fundamentals have improved for the NZD, and in the last meeting, the RBNZ warned that rates could move higher and said it wasn’t planning to lower rates until next year, which is pretty hawkish. That was supported by the strong Q3 employment report which was released last week.
Fundamentals Improve for NZD/USD
According to New Zealand’s Q4 employment statistics, the labor market remained generally healthy. Jobs rose by 0.4% quarter on quarter, rebounding from a 0.2% decline in the Q3 of 2023 and surpassing the market forecast of 0.3%. Wage growth moderated to 3.9% year on year, down from 4.1% in the third quarter but still better than the market consensus of 3.9%. However, the unemployment rate inched up to 4.0% from 3.9%, matching the market forecast of 4.0%. Overall, while there was a slight uptick in unemployment, the employment data suggests continued strength in the New Zealand labor market.
So, buyers put up a fight after the bounce from the support zone around 0.6040-50. The positive news from China also helped risk sentiment for commodities dollars but now buyers are facing the 50 SMA (yellow) on the daily chart. If buyers can push the price above this moving average, then that would break the sequence of lower highs and put the bearish trend in jeopardy. But, we expect the price action to be slow until tomorrow when the US CPI inflation report gets released.
NZD/USD Chart Live
- Check out our free forex signals
- Follow the top economic events on FX Leaders economic calendar
- Trade better, discover more Forex Trading Strategies
- Open a FREE Trading Account


