Solana Bullish, but Bearish Trendline on Daily Chart Keeps Buyers Out

Since July 20, Solana has found some bullish momentum, after touching a low of around 22.20. Solana’s upside has been attributed to the broader jump in cryptocurrencies in the past week.
Observed on a 4-hour chart, Solana has been making higher highs and higher lows, confirming an already developing bullish momentum.
SOL/USD – A Technical Outlook
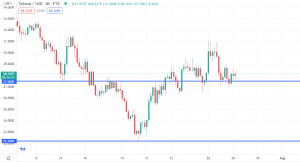
Solana 4-Hour Chart Analysis
From the 4-hour chart above, we can see that SOL/USD is sitting on a support level of around 27.500. Prices have tested this level several times, which means it’s already developing as a major support area. However, prices are showing a lot of indecision and are currently consolidating around the support area.
Looking at the daily chart gives a clearer picture of why Solana is finding it difficult to break to the upside:
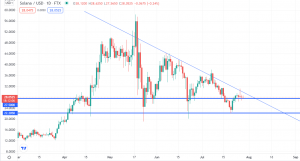
Solana Daily Chart Analysis
From the daily chart above, it can be observed that Solana is on a clear downtrend. A bearish pin bar has formed below the trendline, which means the SOL/USD bears are not yet done with the pair.
Prices are also contained within a descending triangle, offering further clues of the bearish momentum.
SOL/USD Analysis
As long as the bears can keep the prices below the daily trendline, the SOL/USD should continue to consolidate around the support, potentially moving within narrow ranges.
However, with the bullish momentum already forming in almost every cryptocurrency, I expect the SOL/USD to pick up steam in the next few days or weeks.
On its website, Solana claims to offer a common blockchain trilemma, which provides the attributes of decentralization, security and scalability – this is something that other blockchain systems have found hard to do, all at once.
Clearly, Solana has much to offer in the crypto space, and I expect prices to pick up again once the broader market stabilizes.
SOL/USD Trade Idea
From the current level, I expect SOL/USD to retreat downwards. Nonetheless, I do not see the crypto token having a sustained bearish momentum. Prices could reverse quickly at the 27.50 level or slightly below, before surging upwards.
The SOL/USD presents a potential buy trade in the long term. Prices must break above the descending trendline on the daily chart before you consider a buy trade.
I recommend that traders keep watching the pair for now. I do not advise anyone to take shorts from the current level, as the uptick in prices could occur quickly, leaving them exposed. Good luck!
- Check out our free forex signals
- Follow the top economic events on FX Leaders economic calendar
- Trade better, discover more Forex Trading Strategies
- Open a FREE Trading Account
Related Articles
Comments
Sidebar rates
Related Posts
