The Gold Chart All Forex Traders Must See
Is there a simpler chart than the weekly Gold chart right now? Everything is pretty visible, you can easily see where the price is headed a
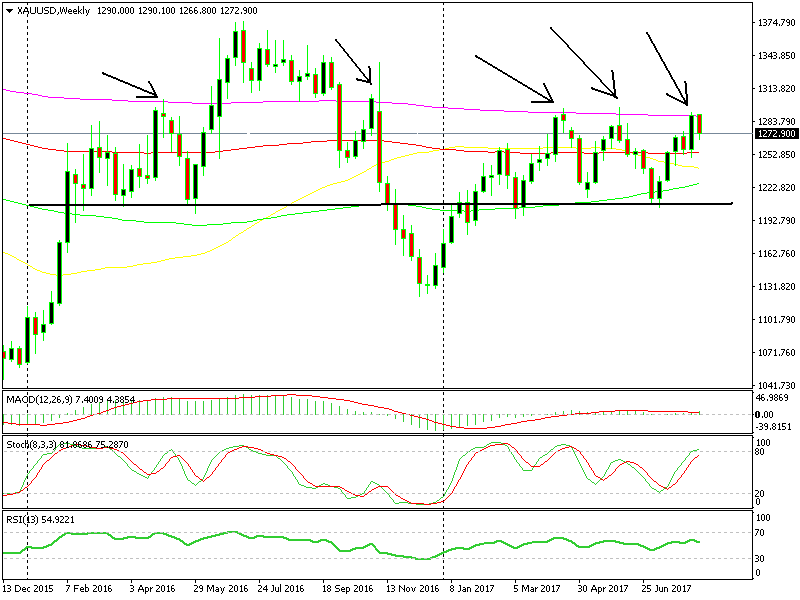
Is there a simpler chart than the weekly Gold chart right now? Everything is pretty visible, you can easily see where the price is headed and where the reversing levels are. You only need patience, lots of it since this is the weekly chart and trades take months.
You can see that there’s a support line around $1,200-1,210, which has been reinforced by the 100 SMA (green), so together they have provided formidable support, apart from a break late last year after Trump won the elections and the sentiment improved. With Gold being a safe haven asset, the market loses interest in it when the sentiment is positive.
 The top and the bottom are pretty clear for everyone to see
On top, we see that the 200 SMA (purple) has been providing solid resistance several times and we haven’t taken it out so far this year.
Right now we´re just below it. The price closed right at this moving average on Friday and it reversed immediately back down as soon as the new week started. We´re nearly $20 below it now and likely to head further down towards the bottom of the range.
Although that will take time and it won’t be straightforward. So, if you wanna sell up here or if you have already sold at the 200 SMA, then make sure to place SL well above it to give the market some room to breathe if it decides to have another go at that moving average. I would say around $1,305 would be “safe”.
Also, be prepared to hold the trade for weeks and even month, but in the end, the reward is pretty huge if the trade succeeds and judging by this chart, the odds are that it will, especially since Kim Yong Un is backing off. Amazing how techncials and fundamentals fall in line quite often, isn't it? or is it a coincidence? Spooky.
- Check out our free forex signals
- Follow the top economic events on FX Leaders economic calendar
- Trade better, discover more Forex Trading Strategies
- Open a FREE Trading Account
- Read our latest reviews on: Avatrade, Exness, HFM and XM
Related Articles

Sidebar rates
Related Posts
