Fibonacci Indicator
Last Update: February 1st, 2025
The Fibonacci trading strategy is one of the most recognized and widely used long-term technical analysis tools in the forex market.

It helps traders put price action into perspective by leveraging the Fibonacci sequence, which closely aligns with the historical Golden Ratio (approximately 1.618). Interestingly, Fibonacci numbers aren’t just limited to financial markets—they also appear in nature, physics, geometry, engineering, and even art, like the spirals in galaxy formations or sunflower patterns.
In trading, Fibonacci extensions play a key role in identifying potential support and resistance levels beyond the current price range. This offers traders deeper insights, especially when trying to predict where the price might reverse or accelerate.
When it comes to forex trading, this mathematical approach shines in situations involving price corrections, also known as pullbacks. But to grasp pullbacks fully, it’s essential to understand the core concept of a trend.
A trend represents the general direction of an asset’s price over time—either upward, downward, or sideways. While individual price movements may seem random, zooming out reveals clear market trends. For instance, if a stock price rises from 100 to 150 over several months, that’s an upward trend. Recognizing these trends is crucial when applying a Fibonacci retracement strategy because without a well-defined trend, the strategy loses its effectiveness.
Key Takeaway: The Fibonacci strategy thrives in trending markets, helping traders identify entry and exit points based on natural mathematical relationships.
What is Fibonacci Retracement?
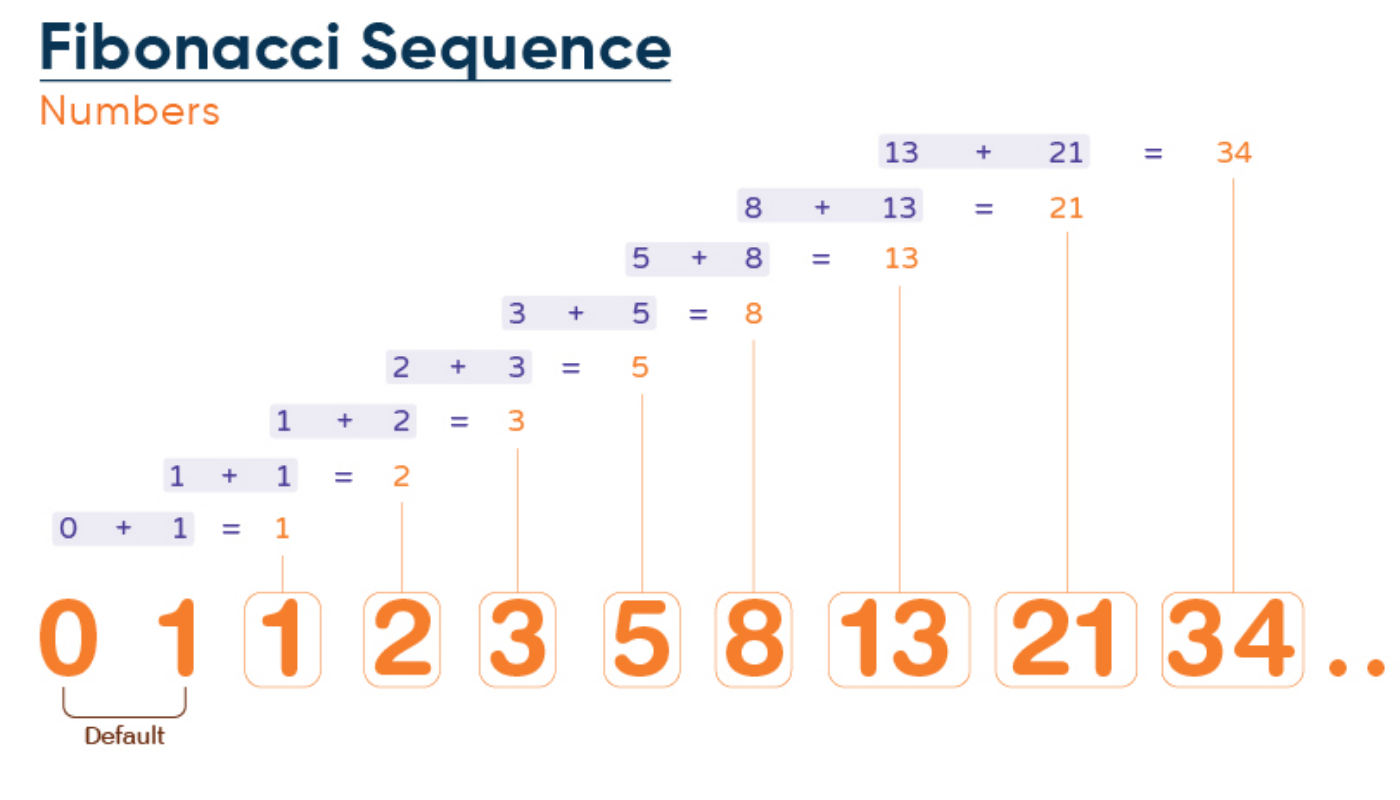
Fibonacci retracement is a powerful technical analysis tool that helps traders identify potential support and resistance levels within an asset’s price action. It’s rooted in the Fibonacci sequence, where each number is the sum of the two preceding ones (e.g., 0, 1, 1, 2, 3, 5, 8, 13, and so on). This sequence leads to important Fibonacci ratios like 23.6%, 38.2%, 50%, 61.8%, and 78.6%, which are widely used in financial markets.
By applying the Fibonacci retracement tool, traders draw horizontal lines at these key levels to highlight areas where the price might find support or face resistance before continuing its original trend. For example, in an upward trend, if a stock rises from 100 to 150, a pullback to around the 38.2% retracement level (approximately 130) could act as a strong support zone.
Why It Matters:
- These retracement levels help traders identify entry points during pullbacks or corrections.
- They also guide traders in setting exit points before potential reversals.
Quick Example:
If Bitcoin’s price rises from 30,000 to 40,000 and then starts to pull back, a Fibonacci retracement might suggest that 38.2% (around 36,180) could act as a support level. Many traders watch these levels closely to make informed trading decisions, enhancing the accuracy of their trading strategy.
History of Fibonacci Numbers
The Fibonacci sequence has a fascinating history that dates back to ancient India. Mathematicians like Acarya Virahanka explored the sequence and its methods around 600–800 A.D., laying the foundation for this mathematical concept. However, it was Leonardo Fibonacci, an Italian mathematician, who introduced the sequence to the Western world in the 13th century through his groundbreaking book, Liber Abaci (1202).
While Fibonacci didn’t invent the sequence, he popularized it in Europe, showcasing its practical uses, especially in solving problems related to growth patterns, ratios, and calculations. Interestingly, the sequence’s unique relationship with the Golden Ratio (approximately 1.618) is evident in nature, from the spiral of galaxies to the arrangement of leaves and even the structure of shells.
In the realm of financial markets, the Fibonacci sequence has evolved into a vital tool for technical traders. Its influence is particularly strong in identifying retracement levels, support and resistance zones, and predicting potential price movements. This mathematical marvel continues to bridge ancient wisdom with modern-day technical analysis, guiding traders in making informed decisions based on historical patterns.
Breaking Down The Fibonacci Trading Strategy

The image above illustrates a moderately short trend, the type we’ll focus on when analyzing the Fibonacci trading strategy. This trend consists of three distinct legs: two upward moves (shown with green arrows) and one downward move (highlighted with a red arrow).
Since the overall direction is upward, the middle segment—where the price temporarily declines—is known as a pullback. Identifying a pullback can be challenging because it’s difficult to determine whether the price dip is just a brief correction or the start of a full trend reversal. This is where the Fibonacci retracement strategy proves invaluable. By applying the Fibonacci retracement tool, traders can analyze price data, evaluate trends, and make informed trading decisions.
Key Points:
- Fibonacci retracement lines, drawn based on key ratios (like 23.6%, 38.2%, 50%, and 61.8%), help pinpoint potential support and resistance levels during pullbacks.
- These levels act as “decision zones,” where traders assess whether the price will bounce back in the direction of the trend or break through, signaling a possible reversal.
For example: Imagine the price of EUR/USD rises from 1.1000 to 1.1500 (an upward leg). After this surge, a pullback occurs, and the price drops to around the 38.2% retracement level at 1.1300. Traders often watch this level closely to determine if it holds as support, potentially offering a good entry point for a long position.
To learn more about using trends to determine trades: Trend Trading – Forex Trading Strategies
Why It’s Simple Yet Effective:
- No complex math is required—trading platforms automatically calculate Fibonacci levels.
- Traders simply interpret the retracement lines to make data-driven decisions.
Fun Fact: The popularity of Fibonacci numbers and ratios isn’t limited to trading. They’re found in nature (spiral shells, galaxies), art (the proportions in da Vinci’s Vitruvian Man), and architecture. In financial markets, these natural patterns help traders forecast price movements with surprising accuracy.
How to Calculate Fibonacci Retracement Levels
Fibonacci ratios. The Fibonacci sequence itself starts as 0, 1, 1, 2, 3, 5, 8, 13, 21, 34, 55, 89, and continues indefinitely, with each number being the sum of the two preceding numbers. From this sequence, we derive critical ratios like 23.6%, 38.2%, 61.8%, and 78.6%, while 50% is commonly used in trading even though it’s not technically a Fibonacci ratio.
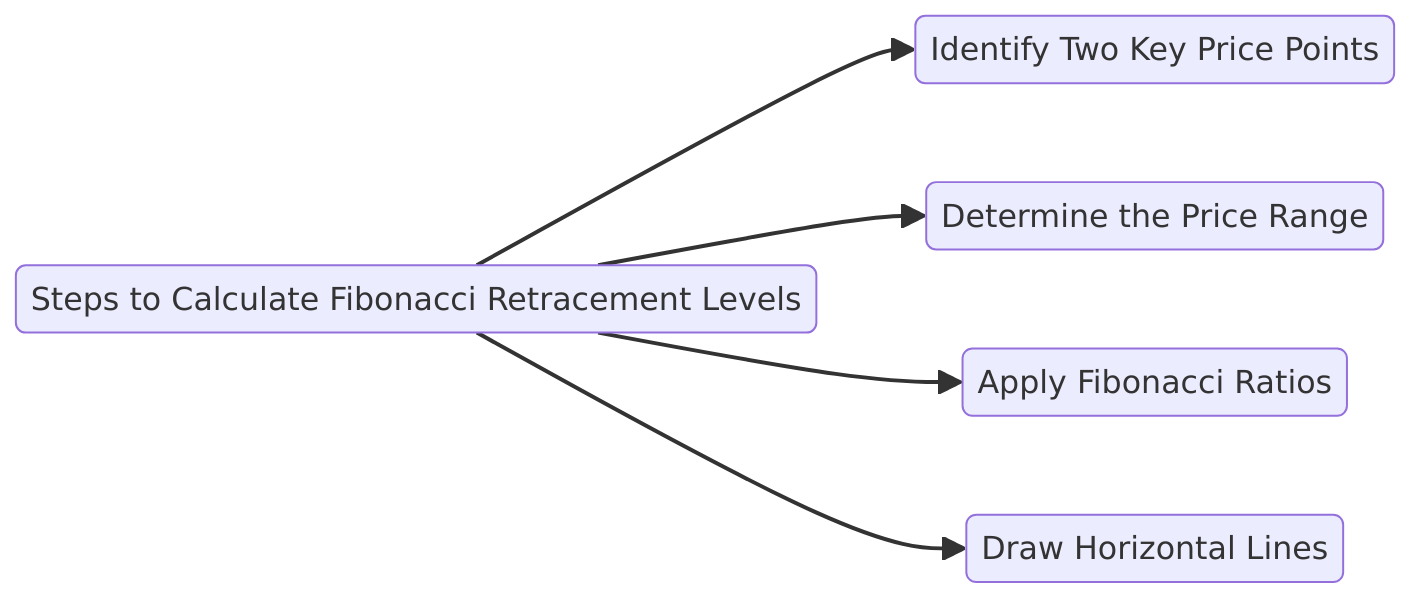
Steps to Calculate Fibonacci Retracement Levels:
- Identify Two Key Price Points:
- Select a significant high point and a low point on the price chart.
- In an uptrend, measure from the swing low to the swing high.
- In a downtrend, measure from the swing high to the swing low.
- Determine the Price Range:
- Price Range = High Point – Low Point
- Apply Fibonacci Ratios:
- Multiply the price range by each Fibonacci ratio:
- 23.6% Retracement Level = (Price Range × 0.236) + Low Point
- 38.2% Retracement Level = (Price Range × 0.382) + Low Point
- 50% Retracement Level = (Price Range × 0.5) + Low Point
- 61.8% Retracement Level = (Price Range × 0.618) + Low Point
- 78.6% Retracement Level = (Price Range × 0.786) + Low Point
- Multiply the price range by each Fibonacci ratio:
- Draw Horizontal Lines:
- Plot these levels on the chart to create Fibonacci retracement lines, which act as potential support and resistance levels.
Understanding Fibonacci Ratios
Fibonacci ratios, derived from the Fibonacci sequence, play a crucial role in identifying potential support and resistance levels within an asset’s price action. These ratios are calculated by dividing specific numbers in the sequence, revealing key percentages that traders rely on to anticipate price movements.
Key Fibonacci Ratios:
- 23.6%, 38.2%, 50%, 61.8%, 78.6%, 100%
- 161.8%, 261.8%, and 423.6% (used for Fibonacci extensions beyond the current price range)
While 50% isn’t a true Fibonacci ratio, it holds significance in trading psychology as a critical midpoint, often acting as a strong support or resistance level.
Why These Ratios Matter:
- Help traders pinpoint entry and exit points
- Assist in setting stop-loss orders effectively
- Offer insight into where price reversals might occur
Example: If a stock rallies from 200 to 300, traders might expect a pullback to around the 61.8% retracement level, near 238, as a potential support zone.
Benefits of Using Fibonacci Retracement
The Fibonacci retracement strategy offers multiple benefits for technical traders, making it a staple in many trading toolkits.
Key Benefits:
- Identifies Support and Resistance: Pinpoints areas where the price may reverse or consolidate, improving trade entries and exits.
- Enhances Market Timing: Helps traders decide when to enter or exit positions, especially during pullbacks within a trend.
- Improves Risk Management: Assists in setting precise stop-loss and take-profit levels, reducing potential losses.
- Works Well with Other Tools: Complements indicators like moving averages, RSI, and trend lines, providing a more comprehensive view of the market.
Applying The Fibonacci Sequence
In practice, there are several Fibonacci numbers derived from the sequence. The three most important are 0.382, 0.5, and 0.618. Also, keep in mind 0.764 and 0.236.
.gif?x65459)
On the chart above, the Fibonacci ratios are the purple lines drawn horizontally. They represent the 38.2%, 50.0%, and 61.8% retracements of the prevailing uptrend. By examining how far the pullback has reached on the Fibonacci scale we can determine two things: whether the price will resume to the bull or reverse into a fresh bearish trend. Either way, we are able to craft a plan to trade each potential scenario.
The general Fibonacci trading strategy rule states that as long as the price remains above the 61.8% line, we can expect the trend to continue. This indicates that the bearish price action is only a pullback, not a full-blown reversal. On the flip side, once the price crosses the 61.8% line, we must treat it as a start of a bearish trend. If we are long this market, it is time to close out and move on to the next trade.
Technical Analysis
The chart above highlights a pullback that bottoms out near the 50% Fibonacci retracement level. This suggests that the price is likely to rebound, continuing its overall upward trend. Recognizing such key levels allows traders to fine-tune their trade management strategies effectively.
How to Adjust Trade Management:
- For Long Positions:
If you’re already long in the market, holding onto the position is a sound strategy, as the 50% level often acts as a strong support zone, increasing the probability of a price bounce. - For Short Entries:
If you’re considering a short position, it’s wise to wait for a more favorable entry point—perhaps after the price approaches a higher resistance level or hits another Fibonacci retracement level like 61.8%.
Why Fibonacci Matters in Trade Management:
The Fibonacci sequence provides a structured framework for dynamic position management. By routinely identifying take-profit and stop-loss levels, traders can:
- Balance Risk and Reward: Set stop-losses just below key support levels (like 50% or 61.8%) to minimize potential losses.
- Maximize Profit Potential: Target previous highs or Fibonacci extension levels (like 161.8%) for potential profit-taking zones.
Conclusion
The Fibonacci indicator remains one of the most effective tools in technical analysis, providing traders with a structured approach to identifying support and resistance levels, analyzing price movements, and making informed trading decisions.
By leveraging key Fibonacci ratios like 23.6%, 38.2%, 50%, and 61.8%, traders can anticipate potential pullbacks, plan strategic entry and exit points, and manage risk more effectively.
Whether you’re trading forex, stocks, or cryptocurrencies, the Fibonacci retracement strategy offers a versatile framework that integrates seamlessly with other technical indicators, enhancing both market analysis and trading performance.
Frequently Asked Questions (FAQs)
1. What is the Fibonacci retracement tool used for in trading?
The Fibonacci retracement tool helps traders identify potential support and resistance levels by plotting key Fibonacci ratios on price charts. This aids in predicting where price pullbacks might reverse, offering strategic entry and exit points.
2. Why is the 61.8% Fibonacci level considered significant?
The 61.8% level, known as the Golden Ratio, is critical because it often acts as a strong support or resistance zone. Price reactions at this level are common, making it a focal point for identifying trend continuations or reversals.
3. Is the 50% retracement level a true Fibonacci ratio?
No, 50% is not derived from the Fibonacci sequence, but it’s widely used in technical analysis due to market psychology. It represents the halfway point of a price move, often serving as a key level where price corrections pause or reverse.
4. Can Fibonacci retracement be applied to any market?
Yes, the Fibonacci retracement strategy is versatile and can be applied to forex, stocks, commodities, cryptocurrencies, and even indices. It works effectively in any market where trends and pullbacks are present.
5. How do traders combine Fibonacci retracement with other indicators?
Traders often combine Fibonacci retracement with tools like moving averages, RSI (Relative Strength Index), and trend lines to confirm signals. This combination enhances the reliability of trade setups by providing multiple layers of analysis.
Sidebar rates
