WTI Crude Oil Near $71 Amid Geopolitical Risks and Rising Demand

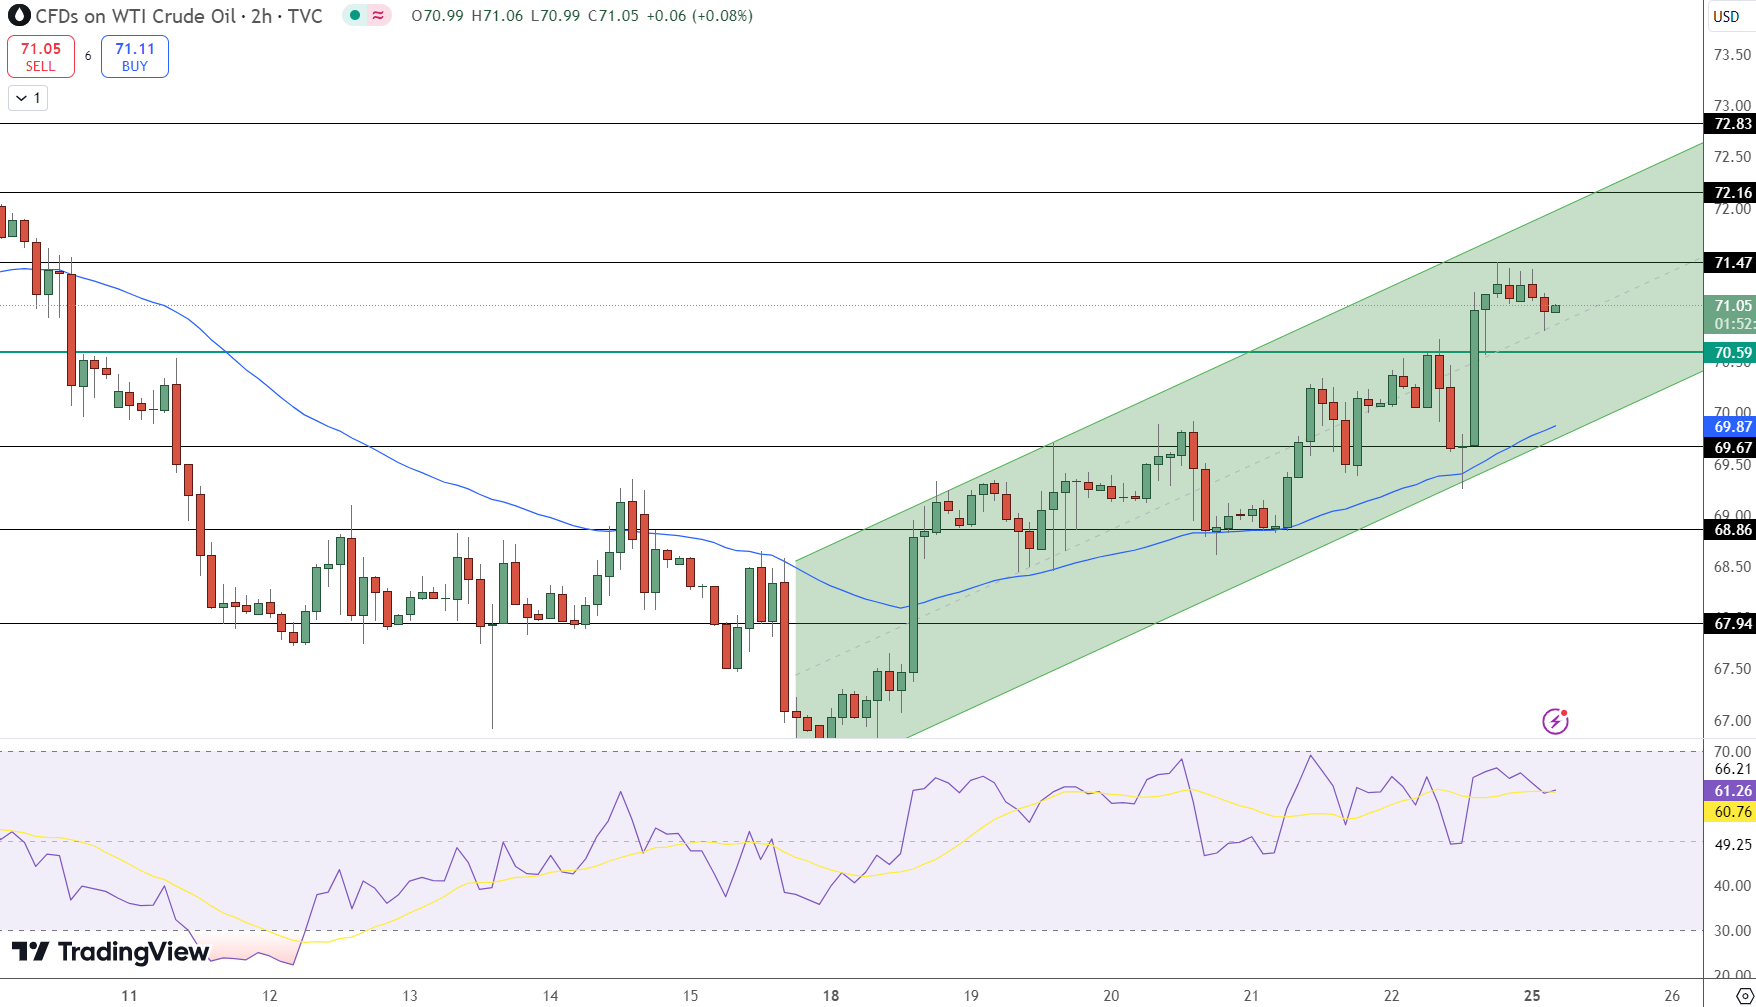
WTI crude oil futures are trading at $71.05 per barrel on Monday, holding near a two-week high.

WTI Crude Oil Price Chart

Rising geopolitical tensions involving major oil producers, including Russia and Iran, have heightened concerns over potential supply disruptions, providing upward momentum for prices.

Last week, oil prices recorded their largest weekly gain in two months after Ukraine launched its first missile attack on Russia using U.S. and British weaponry. In retaliation, Russia deployed a newly developed hypersonic ballistic missile.

Additionally, Iran’s plans to expand its nuclear fuel-making capacity following censure by the UN atomic watchdog have exacerbated tensions, raising fears of further disruptions in the global oil market.

Rising Demand from Asia Boosts Sentiment

Oil prices have also found support from growing demand in two of the world’s largest importers, China and India. China’s crude oil imports surged in November as lower prices prompted stockpiling.

Meanwhile, Indian refiners reported a 3% year-on-year increase in crude throughput in October, reaching 5.04 million barrels per day, driven by rising fuel export demand.

The combined effect of geopolitical risks and growing demand from Asia has supported the bullish momentum in oil prices. Traders now focus on upcoming supply updates and any potential shifts in geopolitical tensions as key drivers for further price action.

WTI Crude Oil Price Chart

Technical Outlook: Key Levels to Watch

WTI crude oil is trading within an ascending channel, supported by the 50 EMA at $69.67, which acts as dynamic support. The Relative Strength Index (RSI) has dipped to 60.76, reflecting moderation in bullish momentum.

Key Levels to Monitor:

  • Resistance Levels: $71.47 (current resistance), $72.16, and $72.83.
  • Support Levels: $70.59 (pivot point), $69.87, and $68.86.

A sustained breakout above $71.47 could push WTI toward the $72.16 mark, while failure to hold above $70.59 may trigger a pullback to test lower support levels.

Check out our free forex signals
Follow the top economic events on FX Leaders economic calendar
Trade better, discover more Forex Trading Strategies
ABOUT THE AUTHOR See More
Avatar
Arslan Butt
Index & Commodity Analyst
Arslan Butt serves as the Lead Commodities and Indices Analyst, bringing a wealth of expertise to the field. With an MBA in Behavioral Finance and active progress towards a Ph.D., Arslan possesses a deep understanding of market dynamics. His professional journey includes a significant role as a senior analyst at a leading brokerage firm, complementing his extensive experience as a market analyst and day trader. Adept in educating others, Arslan has a commendable track record as an instructor and public speaker. His incisive analyses, particularly within the realms of cryptocurrency and forex markets, are showcased across esteemed financial publications such as ForexCrunch, InsideBitcoins, and EconomyWatch, solidifying his reputation in the financial community.
Related Articles
Comments
0 0 votes
Article Rating
Subscribe
Notify of
guest
0 Comments
Oldest
Newest Most Voted
Inline Feedbacks
View all comments