Gold Rally Forecast: Prices May Climb Beyond $2,765 Amid Geopolitical Tensions
Gold (XAU/USD) prices are on an upward trajectory, currently trading near $2,747, fueled by geopolitical tensions in the Middle East. Recent Israeli airstrikes on Iranian military facilities have intensified regional instability, leading investors to seek refuge in safe-haven assets like gold.

According to the Israel Defense Forces, these targeted attacks focused on missile facilities, avoiding critical infrastructure. The heightened uncertainty is attracting global interest in gold, often seen as a secure investment during turbulent times. However, the bullish trend could face resistance from a strengthening U.S. dollar, backed by higher U.S. Treasury yields.
The intensifying geopolitical landscape underpins gold’s appeal, but factors like fluctuating Treasury yields and dollar strength create a complex environment for traders. As these global events unfold, investors are closely watching how the interplay between safe-haven demand and U.S. economic factors will shape gold’s price movements in the coming days.
- Price Range: Trading near $2,747 after reaching $2,758.
- Geopolitical Impact: Increased demand due to Israeli-Iranian conflict.
- Potential Headwinds: U.S. dollar strength may limit upward movement.
U.S. Economic Events Add to Market Volatility
This week, key U.S. economic reports are expected to impact gold prices as investors anticipate indicators that could influence Federal Reserve policy decisions. The S&P/CS Composite-20 HPI, CB Consumer Confidence, and JOLTS Job Openings are set to be released on October 29, providing insight into consumer spending and labor market conditions.
These metrics, along with the ADP Non-Farm Employment Change and GDP data due on October 30, will play a crucial role in shaping market sentiment.
Furthermore, the Core PCE Price Index and Employment Cost Index, scheduled for October 31, will offer insights into inflation trends and labor costs. The week concludes with critical employment data on November 1, including Average Hourly Earnings, Non-Farm Employment Change, and the Unemployment Rate.
These figures will provide a comprehensive overview of the U.S. economy and could drive fluctuations in gold prices.
- Key Dates: October 29 – November 1.
- Important Indicators: GDP, Non-Farm Employment, and PCE Price Index.
- Implications: Data could influence gold’s demand as a hedge against economic uncertainty.
Gold’s Technical Outlook: Resistance and Support Levels
Gold‘s recent rally has been bolstered by a bullish engulfing candlestick pattern, which suggests continued buying interest above the $2,740 pivot point.
The immediate resistance level is positioned at $2,750, with further targets at $2,757 and $2,765 if bullish momentum persists.
The 50-period EMA at $2,733 reinforces the upward trend, indicating strong technical support.
Meanwhile, the Relative Strength Index (RSI) sits at 65, reflecting a bullish stance but nearing overbought conditions, which may signal consolidation before a potential breakout.
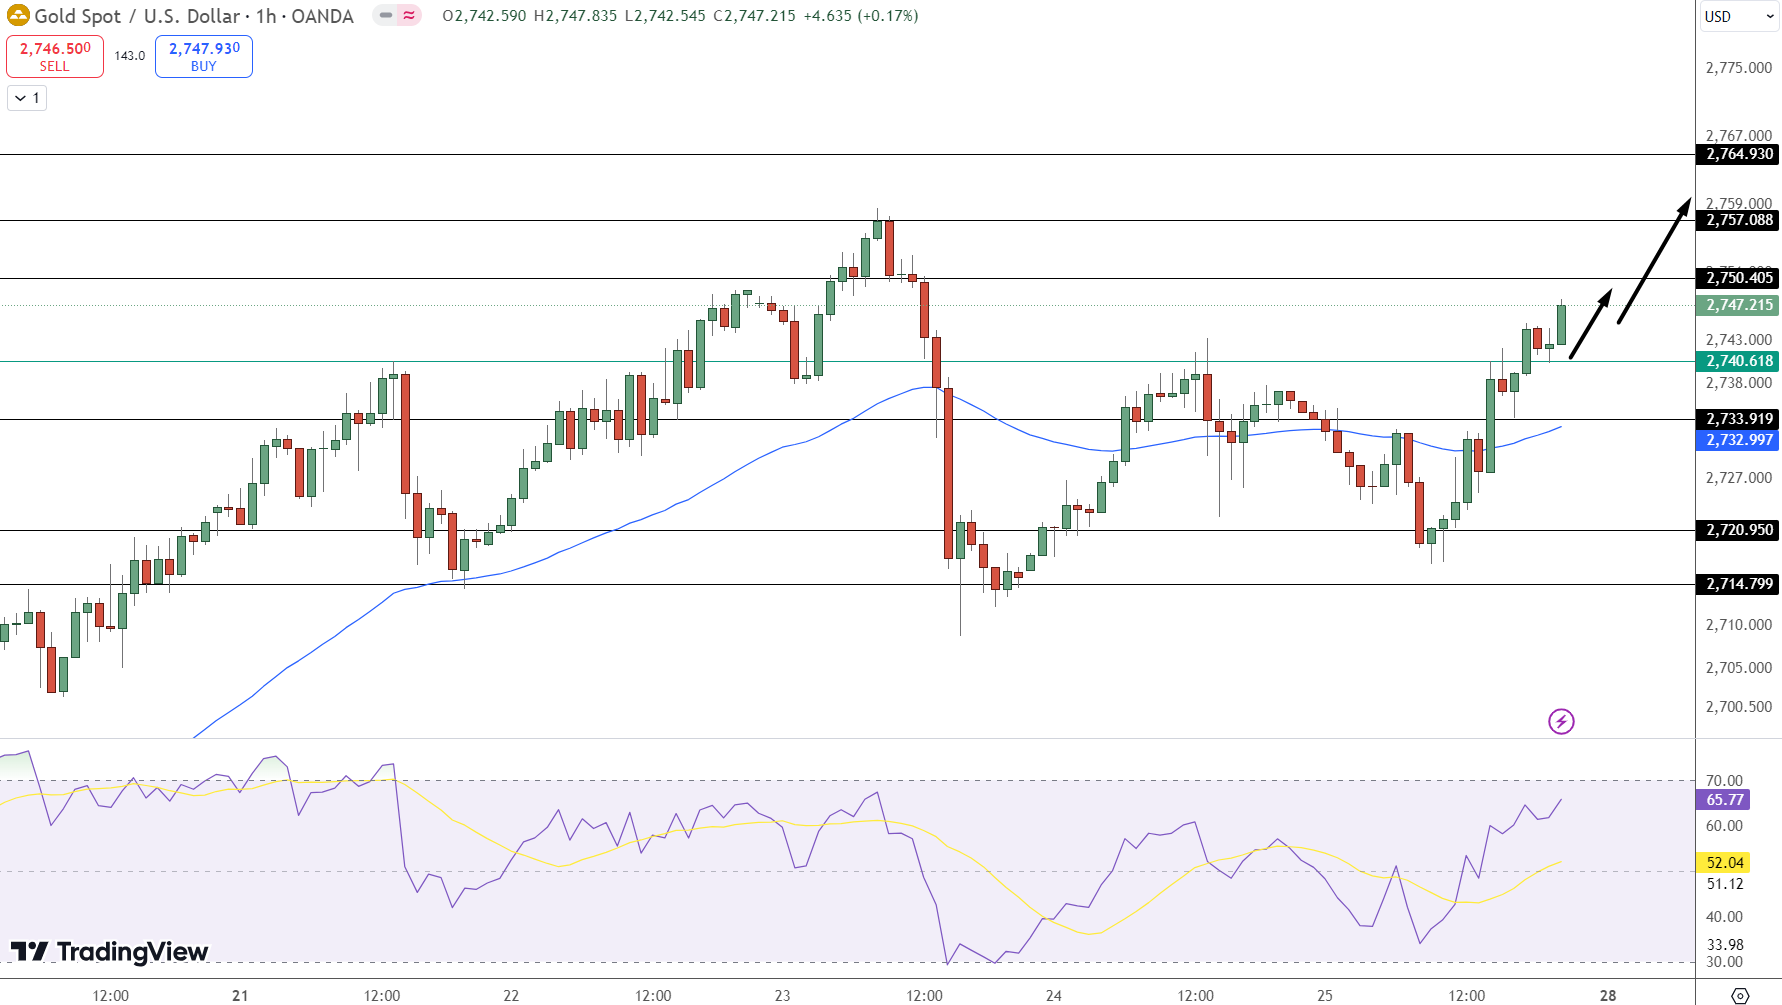
For traders, the key to sustained gains lies in breaking through the $2,750 resistance. A successful push beyond this level could drive gold prices toward the next targets at $2,757 and $2,765, while a failure to breach may prompt short-term retracements.
The combination of geopolitical tensions and U.S. economic data will be closely monitored, as these elements could drive gold prices in either direction.
- Immediate Resistance: $2,750, followed by $2,757 and $2,765.
- Support Levels: Pivot point at $2,740, with the 50 EMA at $2,733.
- Technical Indicators: RSI near 65 hints at consolidation but supports an upward bias.
Conclusion: Gold’s rally shows strong potential, with technical indicators suggesting further gains if prices break above $2,750. Geopolitical tensions and upcoming U.S. economic data add layers of complexity, making gold an attractive yet volatile option for traders seeking safe-haven investments amid uncertainty.


Sidebar rates
Related Posts
