New Zealand Trade Deficit Helps NZD/USD Resume Downtrend
NZD/USD resumed the decline yesterday, extending the bearish trend further as the USD moved higher on bullish Treasury yields. Last night we also received the trade balance from New Zealand, showing another major deficit for September, after similar numbers in August.
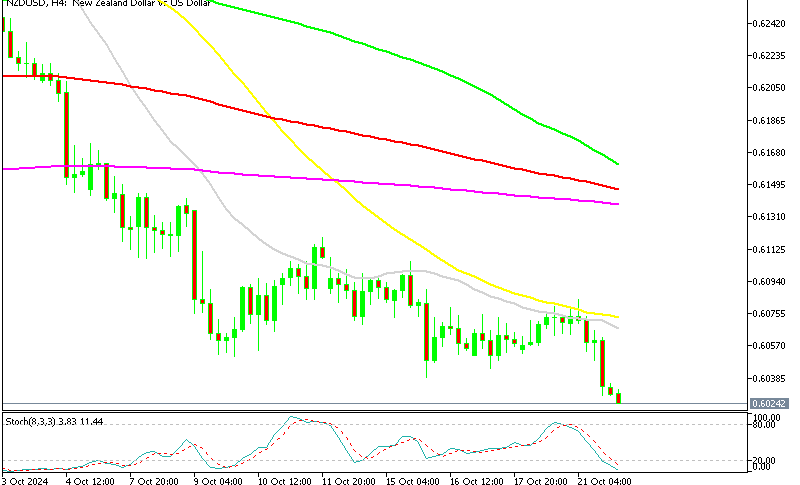
NZD/USD Chart H4 – The 50 SMA Pushes the Highs Lower

After a 5-cent rise in August and September, the NZD/USD pair experienced a sharp reversal in October, indicating a potential break below the 0.60 mark. The pair has already fallen by 3.50 cents and has been steadily declining since early October. Last week, the pair found temporary support just below 0.61, but this week saw further losses, with the pair edging closer to its initial target of 0.60.
NZD Resistance and Treasury Yields
The 100-day Simple Moving Average (SMA) in red is acting as a strong resistance on the daily chart. Sellers returned to the market as U.S. Treasury yields surged higher, boosting the U.S. dollar overall. Despite buyers attempting to stabilize the pair around the critical 0.6050 support level, they were unable to push the price back above 0.61. The 10-year Treasury yield has spiked 10.5 basis points today, now up almost 55 basis points since the Federal Reserve’s rate cut. The 2-year yield has also risen by 45 basis points.
RBNZ and Economic Outlook
The New Zealand economy continues to face challenges, as reflected in the latest Trade Balance report. In response, the Reserve Bank of New Zealand (RBNZ) recently cut interest rates by 50 basis points and maintains a dovish stance, signaling caution amidst ongoing economic struggles.
New Zealand September Trade Balance Report for September 2024
- Imports: $7.12 billion (slightly down from $7.17 billion in August).
- Imports Decline: The slight reduction in imports indicates reduced domestic demand or adjustments in the cost of goods, possibly driven by weakening consumer confidence or business investments.
- Exports: $5.01 billion (a slight rise from $4.97 billion in August).
- Exports Growth: The modest growth in exports reflects stronger international demand for New Zealand’s goods, particularly in agriculture, though the global economic slowdown is still influencing trade flows.
- Year-on-Year Trade Balance (YoY): -$9.09 billion (improved from -$9.40 billion in August).
- Month-on-Month Trade Balance (MoM): -$2.108 billion (better than the -$2.306 billion recorded in August).
- Major Trade Deficit: Both the YoY and MoM trade deficits show some slight improvement, suggesting a positive trend towards narrowing the trade gap. However, the persistent deficit highlights the challenges New Zealand faces in balancing trade as it navigates global economic headwinds.
NZD/USD Live Chart